FCPO Daily downtrendRefer to daily chart, the trend lines still shows it is in bearish downtrend.
MCD does not have red column, no banker chips, only have green color Losechip.
Fortune crown does not have any signal for reversal.
Mirage shows the green column, it is showing money flowing out, bearish market.
Strategy is looking for Short entry in 15min or 1 hour timeframe.
FPOL1! trade ideas

I see the market will continue downtrend backMarket break structure as Harami in Daily TF...best place to short is at 50% and 61.8% Fibonacci pullback

I Wait till market make next movementThe market now can continue for bullish or bearish back to complete downtrend daily sequence...HL break will start back bearish trend

FCPO Still supported for some rise.FCPO Daily chart still in bullish structure. Perhaps to the next top trendline

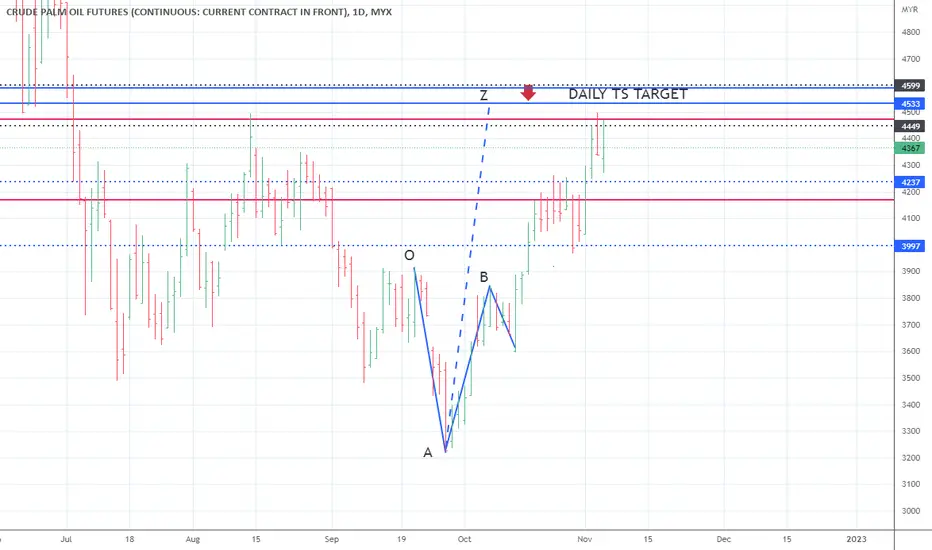
Market look like to start bullish trendThe market already breaks the H4 bullish structure...I think the target price can go up to 4533 and 4554...the target is still intact with my daily target...analysis is invalid if breaks a low Y...


fcpo price is waiting new directionplease watch the level closely. market will wait for the new direction for this week after today level finish

FCPO: CongestionAn update : Expected wave B up has displayed a 5 waves up which warrant a closer look at the following structure as it may kick in other alternative count. Note it resisted at wave 4 of one lesser degree and based on pattern, a possible reverse head shoulder may appear which will support the upside view in the medium term.


FCPO chance break out short position resistance 4220FCPO chance break out short position resistance 4220

Market reach Resistance...breakout or going downtrend backStrong resistance area 4030-4040...the price needs to break this area to keep going up...if failed to break we can see the market continues downtrend back after break 3930
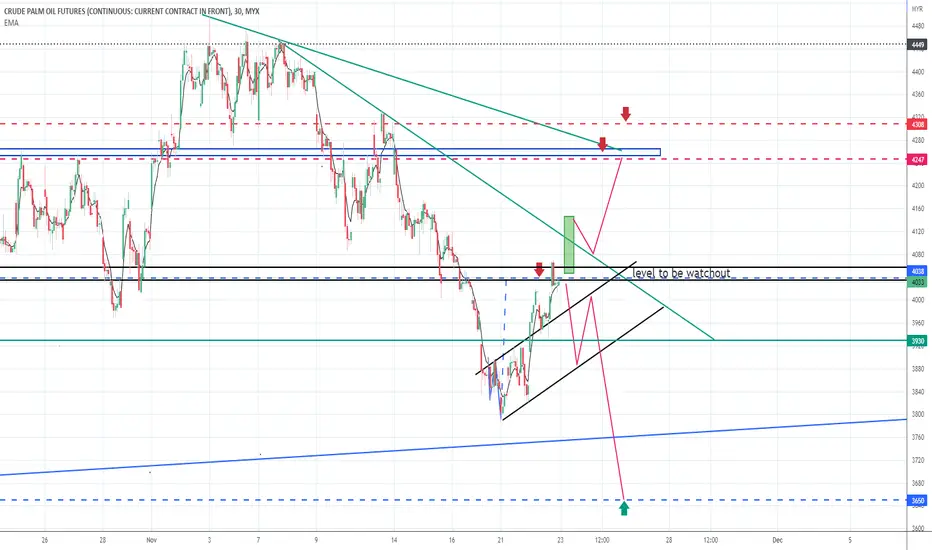
Market looklike to make pullback for double bottom formationCan find buy position during pullback at 3851 and 3815 till 3810...wait for CRS reversal for safe entry

FCPO 1h still in uptrend channelthe price moving up so fast for last 2 days.
Maybe will find the resistance of the channel,
To make a retrace or break it..

FCPO market analysis after GE15Strong support at areas 3790 and 3745...maybe the market will pull back when arrive at the support area...Can try to find buying position if the market makes bullish patterns like double bottom or inverse HnS...The daily bullish structure has broken...can try to find a sell position back after the market has a pullback...

Short FCPO DECEMBER 2022 - MACD MACD EMA 12; 26
Signal line EMA 9
MACD >0 ; Bearish Divergence
MACD BELOW SIGNAL LINE (Bearish; Sell Signal)
Offsetting (Long LMT (TP1 +8% & TP2 +9%)
Offsetting (Long STPL (Stop Loss -8%)

FCPO look like to going up to 4412 areaLook like FCPO will continue to go up till 4412 before going down back...area to buy is at 4253 till 4245...but if the price keeps going down and breaks 4185 I will look to short back...I think the price will go down to 4025 or 3993 to complete the sequence

FCPO FEB 2022Open Long Buy (STP) @RM4313
Close Short (LMT) @RM4405
OR
Close Short (STPL) @RM4272
Potential Upside = (4405-4313) X 5 X 25
= RM11,500


FCPO Wave 5 complete?The daily chart indicates price exhaustion.
Testing UTL, if break below.. possible correction A,B, C with the new trading range 4081~4372

Crude Palm Oil’s underperformanceThis chart caught our attention recently. The Crude Palm Oil – Soybean Oil Spread (in USD per Metric Ton) is trading close to an all-time high now.
This spells trading opportunity for us as Palm Oil and Soybean Oil are generally considered substitute products, which means, at a large enough price difference, buyers may hop over to buy the cheaper one. Eventually closing the price gap back to its historical mean.
Further comparison of Palm Oil against its other substitute, the European Low Sulphur Gasoil Financial Futures, also shows the spread between these products near the high.
A price comparison among the 3 products, Palm Oil, European low Sulphur Gasoil and Soybean Oil underscores this price disparity even clearer. The prices of the 3 products have generally trended together, up until July 2022 when Palm Oil started to underperform.
Stepping back into the macro side, some potential tailwinds for Crude Palm Oil include;
1) The reopening of China, which would increase the demand for palm oil from the world’s 2nd largest importer of the product.
2) Biofuel Mandates, which would put higher demand pressure on Palm Oil.
3) Slowing production growth in palm oil could lead to supply-demand imbalances, pushing palm oil higher as supply falters.
One way to trade this price divergence would be to short the Soybean Oil – Palm Oil spread. This trade can be set up by selling 1 Soybean Oil Futures and buying 1 USD Malaysian Crude Palm Oil Futures. However, do note that in such a set-up, the position is not fully ‘hedged’ as the contract units are different, 1 Soybean Oil Futures has a contract unit of 60,000 Pounds (~27.21 metric tons) while 1 Crude Palm Oil Futures is for 25 metric tons.
Another option would be to trade the exchange listed Crude Palm Oil – European Low Sulphur Gasoil Spread (POG) which handles the construction of the spread and is financially settled, removing delivery risk.
While it’s hard to ‘call’ the top, such price divergence provides interesting opportunities that we leverage if risk is managed properly. These trade set-ups allow us to express the view that Palm Oil’s underperformance will be closed, either by Palm oil catching up with its substitutes or if its substitutes fall in prices.
The charts above were generated using CME’s Real-Time data available on TradingView. Inspirante Trading Solutions is subscribed to both TradingView Premium and CME Real-time Market Data which allows us to identify trading set-ups in real-time and express our market opinions. If you have futures in your trading portfolio, you can check out on CME Group data plans available that suit your trading needs www.tradingview.com
Disclaimer:
The contents in this Idea are intended for information purpose only and do not constitute investment recommendation or advice. Nor are they used to promote any specific products or services. They serve as an integral part of a case study to demonstrate fundamental concepts in risk management under given market scenarios.
Sources
www.cmegroup.com
www.cmegroup.com
jakartaglobe.id
oec.world

Strong resistance from Daily Time frame If the price can make a new higher high...Strong resistance from the Daily Time frame is at 4533 and 4599...can find the setup for a long position or just wait to see what the market is doing...If the market does not make a new high I will stick to my old plan to remain bearish...
Plan to short fcpoMaybe the price will go lower back today...area the price of 4449 is strong resistance to short back...1st target is 4238 if the price break the low of 4270..if the price break the high of 4497 this analysis is invalid

FCPOEP 4481
TP 4655
SL 4238
Backtest result from 2022-09-27 14:30:00
60 trades
59% win rate
p.s: not a financial advice
#deepagiscreener #tayor #fcpo #bukanbuycall
