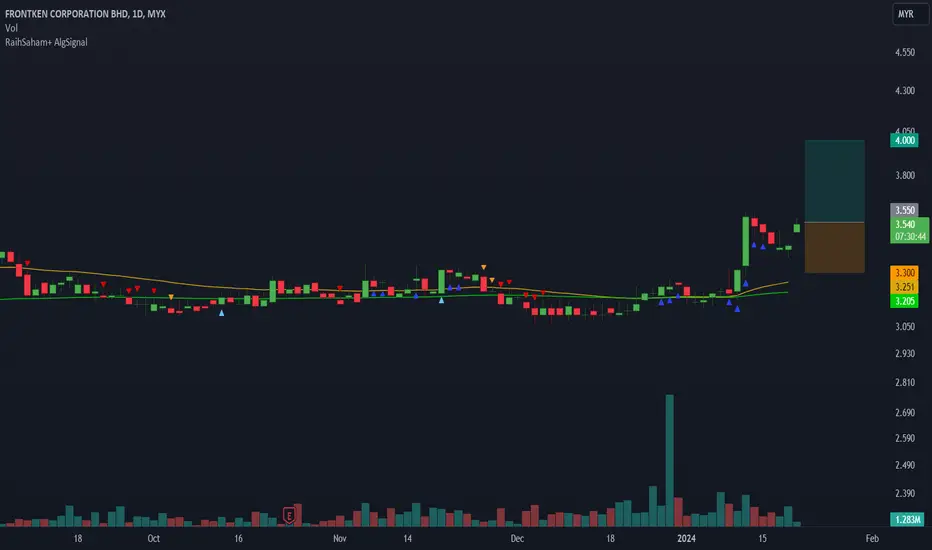
FrontknThe current point exhibits promising upward signals according to my algorithmic system, meeting various criteria. These include rising trading volume, an upward trend indicated by prices above EMA20 and EMA50, and the closing price surpassing VWAP. As a result, the present conditions suggest a poten
Next report date
—
Report period
—
EPS estimate
—
Revenue estimate
—
0.09 MYR
136.81 M MYR
569.20 M MYR
1.12 B
About FRONTKEN CORPORATION BHD
Sector
Industry
CEO
Wai Pin Ng
Website
Headquarters
Petaling Jaya
Founded
1996
ISIN
MYQ0128OO007
FIGI
BBG000PP0X21
Frontken Corp. Bhd. is an investment holding company, which engages in the provision of engineering services. It operates through the following geographical segments: Malaysia, Singapore, Philippines, Taiwan, and Indonesia. The company was founded in 1996 and is headquartered in Petaling Jaya, Malaysia.
Related stocks

WILL FRONTKEN MARKING UP?Based on BIgger view, i am seeing a Schematic #2 of Accumulation (Rising Bottom)
past few weeks, supply has been evaporating
multiple stepping stones formed
Thus i initiated position as attached
pure wyckoff

FRONKTN SWING TRADE SETUP - MOMENTUM TRADING 1. Near 52 weeks new high
2. Price above 10, 20MA
3. Low volume pullback to previous resistance
4. Previous resistance, trend line, 10, 20 MA as support
5. Base pattern setup

Frontkn, expect performed wellTSMC (TSMC) delivered better-than-expected results and even projected healthy growth in 2024 (estimated to grow by 20%+ throughout the year). The stocks that benefited indirectly are FRONTKN and FRONTKN-WB, so the stock price performed well today
FRONTKN, what do you think it will be?>> Need to break above the "pink" downtrend line.
>> Have to stay intact with the "blue" uptrend line to continue rally.
Let the market show us the way.
When the market moves where, and how, and if - these are all unknown. The only thing which we can control is our risk. Focus on risk management!

Frontkn Simple Chart AnalysisFrontkn - Rst 3.3 & 3.47 Supp 2.95
Is just a matter of time to have this big rounding bottom to be complete. Let's see
How to view the guidance via chart ( Refer back to pin message guidance if to trade )
Red Line = Support
Blue Line = Resistance
Light Blue = bullish/bearish pattern
Arrow = Do

Frontken buy FRONTKEN
Buy zone
3.175
3.030
Or just buy because really hard to go down
Sell zone
3.945
4.005
💥Chart pattern

Frontkn Simple Chart AnalysisI bought back recently to trade for a positive CPI data ahead.
How to view the guidance via chart ( Refer back to pin message guidance if to trade )
Red Line = Support
Blue Line = Resistance
Light Blue = bullish/bearish pattern
Arrow = Double/Trip top/bottom
Red Chip = $$
Green Chip = XX

Frontkn Simple Chart AnalysisHow to view the guidance via chart ( Refer back to pin message guidance if to trade )
Red Line = Support
Blue Line = Resistance
Light Blue = bullish/bearish pattern
Arrow = Double/Trip top/bottom
Red Chip = $$
Green Chip = XX

Technical Rebound Trading Strategy Signs in the chart:
1. Heavy sell-off (oversold)
2. Inverse Pullback
3. Break above the upper trendline
Disclaimer
This information only serves as reference information and does not constitute a buy or sell call. Conduct your own research and assessment before deciding to buy or sell any stock

See all ideas
Summarizing what the indicators are suggesting.
Neutral
SellBuy
Strong sellStrong buy
Strong sellSellNeutralBuyStrong buy
Neutral
SellBuy
Strong sellStrong buy
Strong sellSellNeutralBuyStrong buy
Neutral
SellBuy
Strong sellStrong buy
Strong sellSellNeutralBuyStrong buy
An aggregate view of professional's ratings.
Neutral
SellBuy
Strong sellStrong buy
Strong sellSellNeutralBuyStrong buy
Neutral
SellBuy
Strong sellStrong buy
Strong sellSellNeutralBuyStrong buy
Neutral
SellBuy
Strong sellStrong buy
Strong sellSellNeutralBuyStrong buy
Displays a symbol's price movements over previous years to identify recurring trends.
Frequently Asked Questions
The current price of FRONTKN is 4.14 MYR — it has increased by 1.47% in the past 24 hours. Watch FRONTKEN CORPORATION BHD stock price performance more closely on the chart.
Depending on the exchange, the stock ticker may vary. For instance, on MYX exchange FRONTKEN CORPORATION BHD stocks are traded under the ticker FRONTKN.
FRONTKN stock has risen by 0.98% compared to the previous week, the month change is a −1.66% fall, over the last year FRONTKEN CORPORATION BHD has showed a −2.59% decrease.
We've gathered analysts' opinions on FRONTKEN CORPORATION BHD future price: according to them, FRONTKN price has a max estimate of 5.10 MYR and a min estimate of 4.00 MYR. Watch FRONTKN chart and read a more detailed FRONTKEN CORPORATION BHD stock forecast: see what analysts think of FRONTKEN CORPORATION BHD and suggest that you do with its stocks.
FRONTKN reached its all-time high on Jul 11, 2024 with the price of 4.78 MYR, and its all-time low was 0.04 MYR and was reached on Feb 28, 2013. View more price dynamics on FRONTKN chart.
See other stocks reaching their highest and lowest prices.
See other stocks reaching their highest and lowest prices.
FRONTKN stock is 3.22% volatile and has beta coefficient of 3.13. Track FRONTKEN CORPORATION BHD stock price on the chart and check out the list of the most volatile stocks — is FRONTKEN CORPORATION BHD there?
Today FRONTKEN CORPORATION BHD has the market capitalization of 6.47 B, it has increased by 0.49% over the last week.
Yes, you can track FRONTKEN CORPORATION BHD financials in yearly and quarterly reports right on TradingView.
FRONTKEN CORPORATION BHD is going to release the next earnings report on Aug 4, 2025. Keep track of upcoming events with our Earnings Calendar.
FRONTKN earnings for the last quarter are 0.02 MYR per share, whereas the estimation was 0.03 MYR resulting in a −26.57% surprise. The estimated earnings for the next quarter are 0.03 MYR per share. See more details about FRONTKEN CORPORATION BHD earnings.
FRONTKN net income for the last quarter is 31.07 M MYR, while the quarter before that showed 38.10 M MYR of net income which accounts for −18.45% change. Track more FRONTKEN CORPORATION BHD financial stats to get the full picture.
FRONTKEN CORPORATION BHD dividend yield was 0.83% in 2024, and payout ratio reached 42.68%. The year before the numbers were 0.68% and 30.90% correspondingly. See high-dividend stocks and find more opportunities for your portfolio.
As of Aug 4, 2025, the company has 1.38 K employees. See our rating of the largest employees — is FRONTKEN CORPORATION BHD on this list?
EBITDA measures a company's operating performance, its growth signifies an improvement in the efficiency of a company. FRONTKEN CORPORATION BHD EBITDA is 217.79 M MYR, and current EBITDA margin is 36.94%. See more stats in FRONTKEN CORPORATION BHD financial statements.
Like other stocks, FRONTKN shares are traded on stock exchanges, e.g. Nasdaq, Nyse, Euronext, and the easiest way to buy them is through an online stock broker. To do this, you need to open an account and follow a broker's procedures, then start trading. You can trade FRONTKEN CORPORATION BHD stock right from TradingView charts — choose your broker and connect to your account.
Investing in stocks requires a comprehensive research: you should carefully study all the available data, e.g. company's financials, related news, and its technical analysis. So FRONTKEN CORPORATION BHD technincal analysis shows the strong buy rating today, and its 1 week rating is buy. Since market conditions are prone to changes, it's worth looking a bit further into the future — according to the 1 month rating FRONTKEN CORPORATION BHD stock shows the buy signal. See more of FRONTKEN CORPORATION BHD technicals for a more comprehensive analysis.
If you're still not sure, try looking for inspiration in our curated watchlists.
If you're still not sure, try looking for inspiration in our curated watchlists.