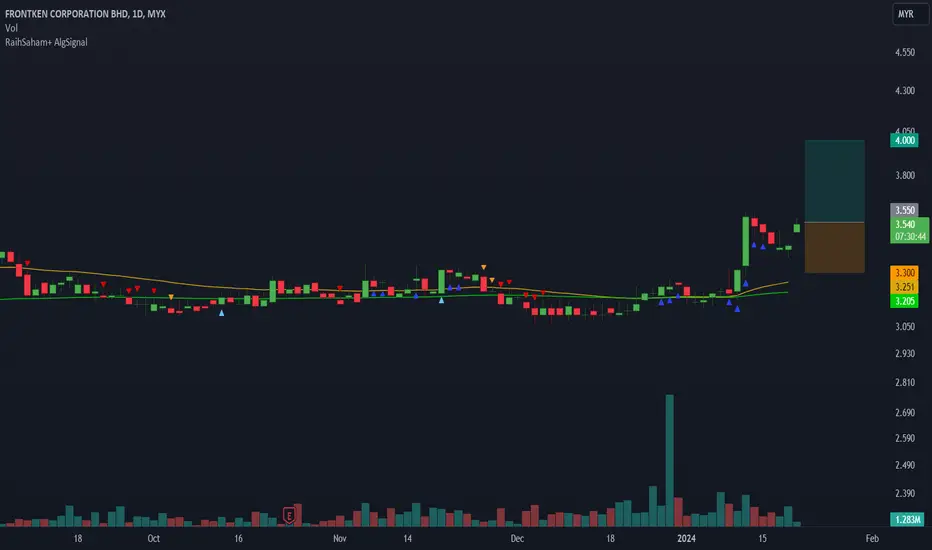
FrontknThe current point exhibits promising upward signals according to my algorithmic system, meeting various criteria. These include rising trading volume, an upward trend indicated by prices above EMA20 and EMA50, and the closing price surpassing VWAP. As a result, the present conditions suggest a potential upward trend.
FRONTKN trade ideas

WILL FRONTKEN MARKING UP?Based on BIgger view, i am seeing a Schematic #2 of Accumulation (Rising Bottom)
past few weeks, supply has been evaporating
multiple stepping stones formed
Thus i initiated position as attached
pure wyckoff

FRONKTN SWING TRADE SETUP - MOMENTUM TRADING 1. Near 52 weeks new high
2. Price above 10, 20MA
3. Low volume pullback to previous resistance
4. Previous resistance, trend line, 10, 20 MA as support
5. Base pattern setup

Frontkn, expect performed wellTSMC (TSMC) delivered better-than-expected results and even projected healthy growth in 2024 (estimated to grow by 20%+ throughout the year). The stocks that benefited indirectly are FRONTKN and FRONTKN-WB, so the stock price performed well today
FRONTKN, what do you think it will be?>> Need to break above the "pink" downtrend line.
>> Have to stay intact with the "blue" uptrend line to continue rally.
Let the market show us the way.
When the market moves where, and how, and if - these are all unknown. The only thing which we can control is our risk. Focus on risk management!
Keep the long term vision.
Disclaimer :
Please be informed that all stocks pick are solely for education and discussion purpose; it is neither a trading advice nor an invitation to trade. For trading advice, please speak to your remisier or dealer representative.

Frontkn Simple Chart AnalysisFrontkn - Rst 3.3 & 3.47 Supp 2.95
Is just a matter of time to have this big rounding bottom to be complete. Let's see
How to view the guidance via chart ( Refer back to pin message guidance if to trade )
Red Line = Support
Blue Line = Resistance
Light Blue = bullish/bearish pattern
Arrow = Double/Trip top/bottom
Red Chip = $$
Green Chip = XX

Frontken buy FRONTKEN
Buy zone
3.175
3.030
Or just buy because really hard to go down
Sell zone
3.945
4.005
💥Chart pattern

Frontkn Simple Chart AnalysisI bought back recently to trade for a positive CPI data ahead.
How to view the guidance via chart ( Refer back to pin message guidance if to trade )
Red Line = Support
Blue Line = Resistance
Light Blue = bullish/bearish pattern
Arrow = Double/Trip top/bottom
Red Chip = $$
Green Chip = XX

Frontkn Simple Chart AnalysisHow to view the guidance via chart ( Refer back to pin message guidance if to trade )
Red Line = Support
Blue Line = Resistance
Light Blue = bullish/bearish pattern
Arrow = Double/Trip top/bottom
Red Chip = $$
Green Chip = XX

Technical Rebound Trading Strategy Signs in the chart:
1. Heavy sell-off (oversold)
2. Inverse Pullback
3. Break above the upper trendline
Disclaimer
This information only serves as reference information and does not constitute a buy or sell call. Conduct your own research and assessment before deciding to buy or sell any stock

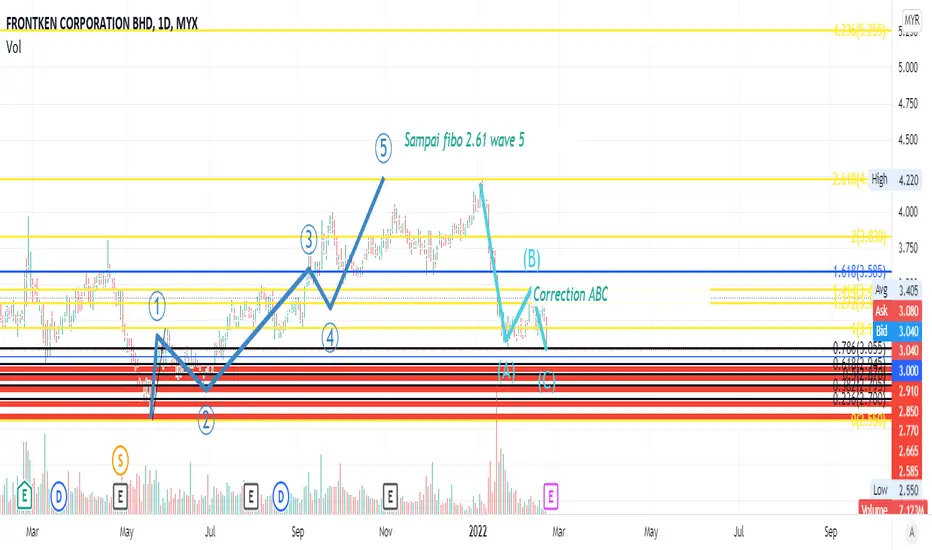
FRONTKN In Wave 4 to complete C correctionThis is my prediction for frontkn . 100% wrong and if it goes right then its only coincidence. Only prediction. Possible places to monitor @Fib 0.618- soon then it will rebound from there to make Impulsive wave 12345.

FRONTKENFrontken (0128) may rally upon an EMA10-EMA20 golden cross. Upside resistance is seen at RM3.47 with next upside resistance at RM3.88. Downside support is RM2.77. A break below this level could trigger further sells off.

Frontkn revisitFrontkn achieved wave 5 and currently is doing the correction ABC. We need to monitor further.
<TradeVSA> Technology Continue to SELL-OFF ! INARI | GREATECSign of Weakness in the chart:
1. Red Pentagon below 20/40ma
2. Upbar low volume
3. UT and ND near 20ma
4. Negative Pentagon Flow
Disclaimer
This information only serves as reference information and does not constitute a buy or sell call. Conduct your own research and assessment before deciding to buy or sell any stock

Frontkn LONGRst New High. Supp 3.5
- My EP 4.08
- Should be a slight retracement pattern here waiting for a candle high break to create another new high
- MACD still on positive area.
- Chip demand are still super huge out there

Long On FrontkenRst New High. Supp 3.5
A new high created today despite a struggling movement in KLSE. Trading strategy on new high is always the same entry at rst breakout. Potential rise will be 4.5 area base on the pattern calculation. My personal trade on this is @ 4.08.
On prospective itself, chip demand is super huge out there. I believe this will benefit all these semiconductor company.
Good Luck & All the best for those who followed.


FRONTKN near term resistance at 4.00High demand and shortage of chips in the semiconductor industry will further drive technology sector higher. FRONTKN in our watchlist given its good quarter results and our BMS chart signals are still bullish. Near resistance would be the first Resistance pivot line at 4.00.

FRONTKN TECHNICAL ANALYSISTechnical analysis for FRONTKN Stock based on Trend Analysis, Chart Pattern and Fibonacci Retracement

frontknfor higher return, better wait one step lower @ horizontal support line.
if break that line, make sure CL immediately or follow ur awesome trading plan.
for me, the momentum still there and wating for volume to explode

FRONTKN Short Base VCPFRONTKN VCP Setup again. This round the base is smaller which around 40 days.
C1: -12%
C2: -4%
C3: -4%
QR released 3 Nov. Fundamental FRONRKN no need to mention much. Awesome prospect. And Tech sector is hot right now.
Disclaimer:
Not a buy call recommendation, just sharing on chart pattern formation based on my personal experience. Trade at your own risk.

A clear trend with weekly candleDont buy at high prices, monitor the another retrace and a new trends

Frontkn Volume Contracted PatternIn able to understand Volume Contracted Pattern (VCP) as per Mark Minergini inroduced:
1) contracted volatility
2) contracted volume
3) pivot point
4) uptrend previously
The Pattern will be true if Price Breakout the All Time High with volume
If we study the Fundamental Analysis Frontkn is a growing Company included in Technology Sector with good prospect in future.
