CBoT beanoil still shortBeanoil:
Price traded further into its resistance area of the 3200 level and actually traded higher than what we would have liked to see. For twice in a row (Thursday and Friday) price traded into our pre-set stop-loss zone but still closed below same stop levels and we are still in position. Even though the resistance zone is tested more severe than we initially anticipated the overall pattern does not change and we keep our bear bias until we are proven wrong by the market. Our reconsideration point is still at the 3385 mark and the stop is still at 3260 but that is more for money management reason than anything else. The last two sessions hunted the price up but momentum went lost and the chart shows two candles with long topping tales which is a sign that the bulls ran out of air. We are still on the edge and we will start feeling more comfortable with our bear bias after we see price trading decisively to the 3120 zone which we would like to see happening during the coming week. After that we will trail our stop to entry level and will start looking for a target.
FSOY1! trade ideas

Beanoil CBoTBeanoil:
Price has made its test back to the resistance level of 3200 which has set the floor for a solid bear move. Initial stops are at 3260 for this run and if price would break the 3385 level we will have to turn back to our drawing board and reconsider our bear bias again. In case that our initial stop gets hit we will look at a renewed short entry opportunity later on. Initial target has not been set yet as we first want to see price to get on its way so that we can trail the stop to entry level but we are in for a 10% move at least.

Beanoil CBoTBeanoil:
Price broke out through the downside of the long term ascending price-channel which means that we have to go back to the drawing table and reconsider our bias. Our bullish scenario has failed an stops were hit. Former support at the 32 level has now become resistance and we expect same resistance to be tested some time during the coming week or week after. Same test would offer an excellent short entry opportunity.


Beanoil CBoT N16Beanoil:
Price initially followed our preferred routing quite precisely but suffered a pull-back during the last two sessions that was deeper than we would have liked to see. Our bias with price target remains intact although a decisive move further down to 31.50 would be a conclusive sign to us that we should reconsider our short term bull bias. Our longer term view on beanoil is bearish but for now we still keep our eye on the 36 target by the end of May and we have not changed the chart.

Beanoil Long PlayPrice has been following our preferred path quite nicely last week and tested the downside of the ascending price channel from where it made quite an impulsive bounce up during last Friday's session. Friday's candle was a strong one and had the characteristics of a 'Bullish Engulfing' candle which is a solid sign that price wants to reverse and go up from here. The candle was also a 'Double Key Reversal' candle with a lower low than the previous day but a higher close than the two previous candles which is a very solid bullish bode as well.
As far as we are concerned the price is on the way to our target of around 36/37 by latest the end of May which is at the upper boundaries of the price channel and some 8-10 percent up from its current level.

Beanoil almost ready for a longBeanoil:
Price has been moving in a wide-ranged ascending channel from Sep/Oct15 onwards with higher highs and higher lows. Since about two weeks price started again a correction to the down side but still within the boundaries of the ascending price channel.
The candle of last Friday was a perfectly shaped ´inverted Hammer´ which is a strong reversal signal and which indicates that a reversal of the price back up is imminent. Price could well trade a bit lower during the first 2 or 3 trading sessions of next week but we expect price to reverse back up soon.
We favour a bit further decline to the 3250/3200 level during early next week after which we expect price to trade back up to the 3600 level during the remainder of May and possibly into June.

CBoT beanoil short play set-upA renewed set-up on the beanoil chart after our last set up earlier this week did not materialize as the selling trigger lacked. Today we see price making a so-called 'bearish engulfing' which is a reliable reversal pattern.
Price kept its divergence with it MACD and RSI: higher highs in price (compared to it last high at close on December 4 at 32.35) but not charting higher highs on its MACD and RSI.
Since March 3 price has started to trade within a steep channel upwards which was broken only today and, if no rally occurs towards today's close, price will close below the lower boundary line of same ascending channel.
It is worth entertaining a short play here at the close or tomorrow's opening but only provided that price closes at/below 33.45 and with a very tight stop at 34.25 basis intra-day.

CBoT Beanoil possible short set up in the makingWe have a possible short set-up in the making here.
The beanoil MAY16 chart is of 11am CDT so the session in Chicago has not ended yet. The candle could be a 'shooting star' in the making which, principally, is a bearish sign and it is a reliable bode that the end of the move up is imminent.
More important, however, is that the chart is showing divergence between the development of price on one side and its RSI and MACD on the other side: price has made a new high yesterday whereas its RSI and MACD did not. This is a very strong sign that the market is overbought and needs correction. In addition comes the aforementioned 'shooting star' which adds to the reversal probability. Too early and too much of aggressive approach for this trader to enter a short play here and now already as we want to see a confirmation. We keep the gear in 'neutral' but will have a close look again during the session on Monday next. If and when we see a negative candle developing during Monday's session it would mean that an 'evening star' is in the making which is a reliable reversal pattern. This in combination with the divergence and the 'shooting star' legitimises a short play with a tight intra-day stop above the high of today.

Beanoil is still in a down trendAfter the continuation pattern as detected earlier this week we see that price has formed a descending channel.
Combined with the earlier mentioned short set-up we keep looking at the downside with first target 30.00 where half of the position will be close. Current stop is at entry level and is being trailed down accordingly.

Beanoil short play opportunityPrice is now making correction in time. A move sideways is a continuation pattern. Add to short at 31.75 with a stop above 32.00 basis end of day.

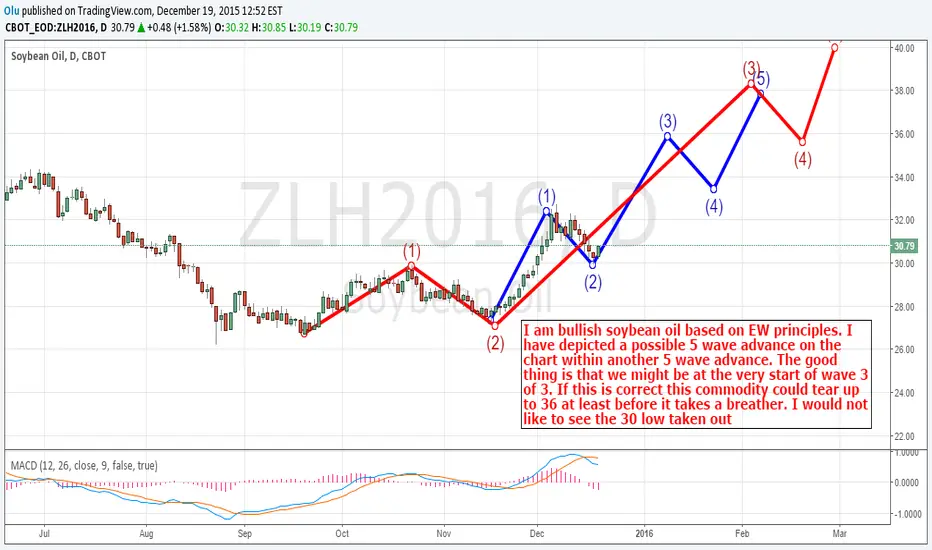
Soybean Oil: I am bullishComments on the chart. All the grains seem to be putting a bottom giving more validity to this idea
Long March Soybean Oil - 2 Target TradeSimple trend-line setup on Soybean Oil. 2 targets on this one. 15/1 Risk/Reward to the 1st target.

Soybean Oil - Push or Pull?Weekly:
- Trend is a trend, until its end. Is the end getting closer? Trendline matches Kijun Sen and horizontal key level.
Most important to watch is 32,05!
- Heikin Ashi candle turns red, haDelta crosses down SMA3, the setup is rather bearish again. Question as always is the weekly close, and if Bears can push it down to a lower low later.
Daily:
- Price trades exactly at equilibrium! Kijun Sen and thin future Kumo stays at same level ard 31,35-31,50.
- Heikin Ashi candle turns bullish, haDelta up. Chikou Span close to Price.
Bears really need to make a push soon, or else they can quickly lose control and capitulate. In case Soybean Oil breaks above 32,05 and later above 32,50, then we wil see a trend break and reversal, a confirmed bullish Kumo breakout on the daily chart, with high probability tgt to 35, and lower probability tgt ard 37.
I am watching it for a reversal long trade.

Soybeans - Selling pressure eased this week, swing buy nowWeekly:
- Ichimoku setup is still bearish, but weekly Kijun Sen dropped and got close to price candle.
- Heiken Ashi candle this week has a smaller body with both upper and lower wicks, its body is within prev candle body. haDelta crosses back above SMA3, but both lines are still below zero level. This is a sign that the selling pressure could not accelerate further this weak and by next week we may see either more consolidation or a correction (move up) back above Kijun Sen.
Daily:
- Ichimoku setup is bearish, but turning back to neutral a bit again. On the daily chart we also see how selling pressure eased this week. The Kumo's Senkou lines are flat, not pointing down, so more downside seems less likely. Kijun is also flat and Tenkan turning up, so does Chikou Span, which losing its open space. Consolidation and further pullback is expected.
- Four Heiken Ashi candles are green in a row, both haDelta and SMA3 are above zero line, the oscillator is up again
- Further price increase up to Kijun and SenkouB (both ard 1007) is very likely, a real bullish reversal however can place only above the Kumo. May this happen at some point, we still need to wait 1-2 more weeks for that.
Recommendation: Buy and hold small long. Increase and leverage up if you see a break above Kijun (future Senkou B or if you are more conservative when you see a break above actual current Kumo cloud.

Beanoil - ZLK2015: bear trend resumingBean Oil is coming out from a congestion area started in Sept2014. Bear forces resuming. Targeting 30.75 by the 23Jan

Soybean Oil - It can become a hot trade soon againSome exotic for today.
I really like to look at products which has been consolidating for long time.
Yesterday I published a post about wheat, corn and soybeans (see link below), where I showed you how soybeans has been moving sideaways in an appr. 5 %+ range. The case is same with Soybean Oil. It has been moving sideaways for 3 months now. Why do I think it is important? Let me show you a few things.
Daily:
- Obviously the Price action is totally neutral, it has been consolidating for more than three months now, as you see in a range between 31,40-33,40, except one squeeze and breakout attempt, which however was blocked then by the thick Kumo Cloud.
- Flat Kijun Sen, flat Kumo, Chikou Span is swinging ard Price candles, very low ADX. -> all in all there is no trend.
- What makes me think a break on upside has slightly bigger chance is the positive divergence in MACD and in Slow Stoch in forms of higher lows. Also despite low ADX, DMI is rather early bullish. These are all weak signals, put worth to watch.
- Upper resistance is clearly at 33,40-33,50 at the horizontal line and the inner trendline. A sustained break above this level could bring a quick bullish move.
Weekly:
- Ichimoku setup is bearish, but Kijun Sen is catching down to price, and getting close in touch with the steeper trendline's level.
- MACD is kind of bullish and here we also have a Slow Stoch cross with higher low.
- DMI is close to cross bullish (ADX dropped as well), so probably the price decline for medium term can be over, and we may see some correction.
- And look at the Price action itself! If you zoo out the chart, you can not find one more period, where the Price was so stable, stuck in such a thin range! Obviously we do not know which direction it will start the next move, but I am sure the move will be sharp and quick. If the break happens on the top side, the retracement tgt is ard 36,50. If it can not hold the 32 +/- level then bearish extension would hit it down to 26-27.
p.s.: watch it close together with its big brother, the Soybeans.

Educational Piece: How To Find Tops And Bottoms w/ NO IndicatorsA While back I did a post on EURUSD Showing probability of the big move down we’ve seen.
Here is the Link: www.tradingview.com
About 3/4 of the page down I posted another chart with support levels. I received a few questions where I could tell other traders were looking to buy at the first major support levels.
I asked this Question: IF Price does start to Rally…How will you know if it’s a good time to buy? And How would you know if it’s a short lived rally giving you a good place to short at better price Levels.
I went in to detail on what patterns to look for based on Institutional Order Flow. You can read my answers near the bottom of that page.
I posted this chart for TWO Reasons:
#1 it’s Soy Bean Oil so it’s easier to just observe theh chart without having a Biased Opinion since very few people on TradingView trade this instrument.
#2 ***This chart shows perfectly two examples I discussed on a How to know it’s a good time to Buy, and the second example shows how you would know it’s a False Rally giving you a better Price to Add to Shorting the symbol.
***Draw the Major Support and Resistance levels I discussed and showed on a chart 3/4 of the way down on the link at the top of this page.
***This Chart looks VERY Similar to the EURUSD I posted in that link.
*******One of the best Quotes I’ve ever heard that Dramatically impacted my Trading is this, “When your Looking at a Chart ask yourself this, What would have to Happen for the MOST Retail Traders to Get HURT”!
When you get good at answering that question…And when you get good at recognizing Institutional Buying and Selling Accumulation, and Institutional Stop runs. You will be able to trade any chart with a HIGH Probability of Success…WITH NO Indicators!!!!
Institutions MOVE Markets…PERIOD. By evaluating Institutional Price Action along with Major Support and Resistance levels. (Without a BIASED Opinion of what You Think Price Will Do)…You’ll be able to “Print Money” out of the market.

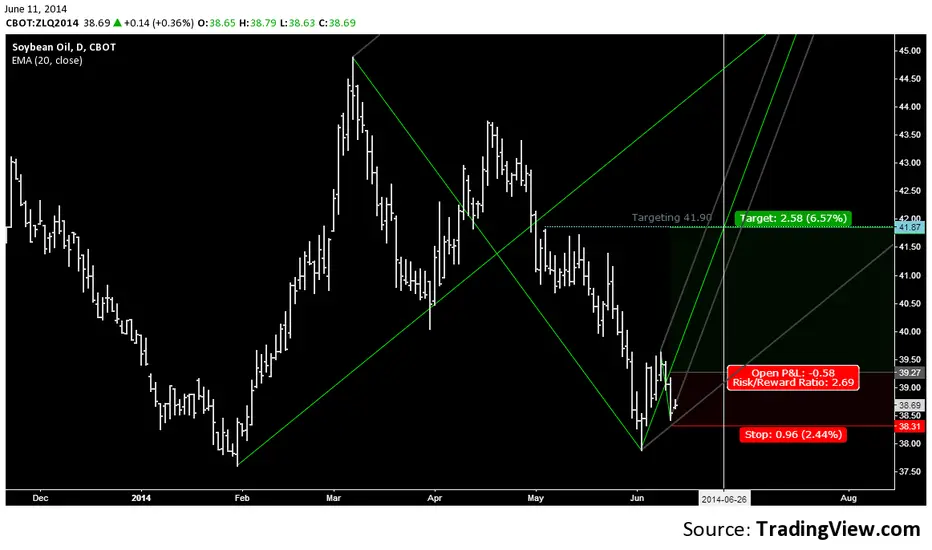
Bean Oil gives a buy signalBean Oil (ZLQ14) is oversold in the medium and short term and could turn higher at this point. I'm entering long at 39.27 with target objective 41.87 (next resistance and median line) The target should be reached by 25June2014.