GDB trade ideas
GDB - to continue its uptrend ?1. GDB - according to the theory is in a real uptrend (MA50 over MA200 Weekly)
2. Make a Double Bottom with accumulation for 570 days
3. Rebound from minor support (0.295) with volume that is larger than average
4. Interesting to follow if BO 0.355/0.360 Minor Resistance, which is also AVWAP line
TAYOR.. Kajian ini untuk pembelajaran diri sendiri sahaja

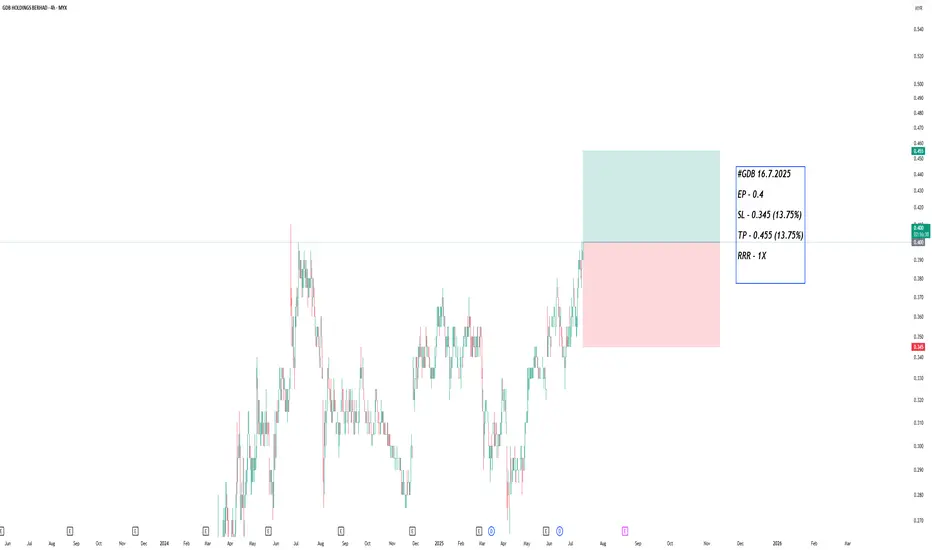
GDB, Algo TradingSystem Remisier CheDinThe current point exhibits upward signals according to my algorithmic system, meeting various criteria. These include rising trading volume, an upward trend indicated by prices above EMA20 and EMA50, and the closing price surpassing VWAP. As a result, the present conditions suggest a potential upward trend.

KL:GDBAn affiliate company of Permodalan Nasional Bhd (PNB) has awarded GDB Holdings Bhd (KL:GDB) with a contract to develop a logistics center Shah Alam, valued at RM865.66 million, over three times its market capitalisation of RM304.54 million.
The news supports a story from The Edge Malaysia which cited sources and said that GDB was near to landing a sizable contract to construct a warehouse in Shah Alam, Selangor.
The construction company declared in a filing with Bursa Malaysia on Friday that Strategic Sonata Sdn Bhd had awarded it a letter of award for the building of Plot B of the logistics hub.
Strategic Sonata granted construction behemoth IJM Corp Bhd (KL: IJM) plot A of the logistics center, according to a separate filing.

GDB, AlgoSignal reveals potential uptrendSeveral indicators within my algorithmic system are signaling a potential uptrend. These include:
- Increased volume: Activity is picking up, suggesting growing interest and potential momentum.
- Mid- to long-term uptrend: Both the 50-day and 150-day exponential moving averages are pointing upward, indicating a sustained positive trajectory.
These factors collectively point towards the possibility of an upward movement in the near future

Trading Plan using Trend line and Elliot Wave Theoriesas you can see, right now GDB's price is declining while the trend also shows a downtrend that started at beginning of 2021 till now. If we look at a bigger time frame chart we will see that this downtrend is merely a price adjustment to locate the main trend. The main trend for this company is an uptrend. I believe that the price will rebound back upward after the price touches the main trendline and maybe create a new high.
There is also additional support that supports my claim that the price will go upward again after the price touches the main trendline. If you look at the chart, I have drawn an Elliot Wave on the upper part of the chart. This wave was taken from a chart. Currently, this wave still does not perfectly form. According to theories, the price will not fall further than the red zone and will be bound back upward to complete Elliot Wave Circle.
Furthermore, at the time price touch the zone, the indicator below the chart will cross the bottom line and rebound upward to an indicated buying signal

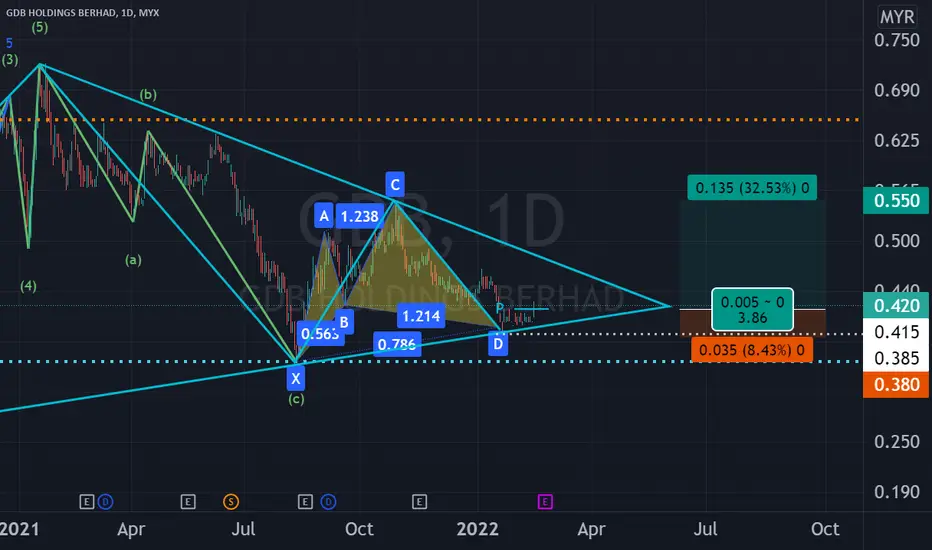
GDB in MULTIPLE FORMATIONSConsider to study, analyze and monitor GDB in its daily chart where the following patterns appear to have been formed: 1. Triangle; 2. Bullish Cypher and 3. EW ABC Corrective Zone at C zone.
Trade within the triangle or trade as per the potential Cypher Pattern Trading Plan as depicted in the chart.
This is not a trade or investment call but for study and sharing purposes only with a view to develop and enhance one's trading knowledge and skill. Trade at your own risk.
stay to basic, take longTrend:-
The chart shows a beautiful uptrend for a long term and downtrend for mid term.
According to indicator:-
William r shows that the price has started to turning up and already past -80 line indicated that the price will go up
Stochastic also show that the line has past line 20 and blue line has cross the orange line. Furthermore, the line also has touch line 20 which indicated that price will go up.
As for fundamental:-
This company has low debt
Has a low Earnings Before Interest Tax but never negative in past year
Show a grow in asset every year indicated that the company is growing
you can see it yourself, if you don't believe me
Investment strategy:-
take long term long
take a mid term long

GDB TECHNICAL ANALYSISTechnical analysis for GDB Stock based on Trend Analysis, Chart Pattern and VPA

GDB breakouttop shareholder
CHC Holdings Sdn. Bhd. 48.94
Tzone (Leong Lo Alexander) 21.07
Hong Leong Asset Management Bhd. 4.57
PMB Investment Berhad 3.32
Principal Asset Management Berhad 2.86
Yayasan Islam Terengganu 2.46
PMB Shariah Aggressive Fund 1.41
PMB Shariah Growth Fund 1.09
Eastspring Investments Berhad 0.73
Eastspring Investments Small-cap Fund 0.73

GDB Analysis base on fibo , trendline stochastic and rsi.. buy at area below 0.40 which is green horizontal line is strong support

GDB AnalysisDisclaimer: This is not a buy call but for learning purpose
Analysis
Around major uptrend line
Triangle breakout?


GDB - ideas updateNote
-Some potential counter. Look for best entry/exit. Suggestion are on the charts.

GDB: possible BB breakout?MACD setup is good, volume increasing, with banker's chip presence and RSI more than 50%. It seem the momentum is there for a BO


GDB Getting Drastically BullishCorporate Name : GDB HOLDINGS BERHAD
Symbol & Code : GDB (0198)
Board : MAIN
Shariah : Compliant
Sector : Construction
Sub-Sector : Construction
• Weekly: GDB is moving in a steady uptrend. Price soars above 20MA signifies good momentum. Bullish engulfing pattern
• Daily: Price reversal at 0.77 and GDB made a bullish move breaking previous high at 0.975. Price stays above the new support.
• EP: EP 1-1.06

GDB (Construction) - Ideas update!Note
- Duly noted in last week the price were heavily retrace, and definitely impulsively increase after until back to original state (0.0%)
- It has a few week of progress until its first earning this year which came on mid of February, 2021
- I plotted new pivot point, suggesting buy entry & 2.5% TP. (alert setting)
- If it may retrace from OPR, suggest to take careful close up to its price motion, which will be our SL is not more than 1%

GDB pullback completed and ride on!While most of construction stocks has been battered badly from the uncertainty in job market and start to recover from the stimulus package, GDB has been one of the outperformed developer cum construction company after October 2020; steadily increase in price and now continuation the uptrend after the short rest past 3 weeks. Formed a V shape recovery soon after the bottom, and now completed pullback.
Here some point to look into
1. Uptrend. Completed pullback with wide spread up bar with higher volume than 2 previous bar.
2. 10/20 MA has crossed over.
3. MACD also crossed over.
4. Support 0.995, EP 1.05, TP 1.29 (fibo 1.618). R/R is 3.69
5. background is green and continuation uptrend. Buyer in control
6. Im holding 1.02 to be honest.


GDB - May See Further WeaknessGDB
Rst: 0.975
Spp: 0.875
The violation of Fibo Ext 100% as well middle BB means the stock has tendency to invite further weakness towards 50% or level close to lower BB.

GDB - Three White SoldiersGDB
Rst: 0.97
Spp: 0.93
Strongly intact bullish momentum, previous RSI bearish divergence being neutralised. But do note red candle usually may follow after three white soldiers appeared. As long as it can sustain at 0.90 area, hitting RM1 psychological level is possible.

