[25.1.2020] - Trading Idea GTRONIC 7022Disclaimer: The information here is not an investment advise nor trading advise. It is very important to do your own analysis before making any investment decisions based on your own personal circumstances.
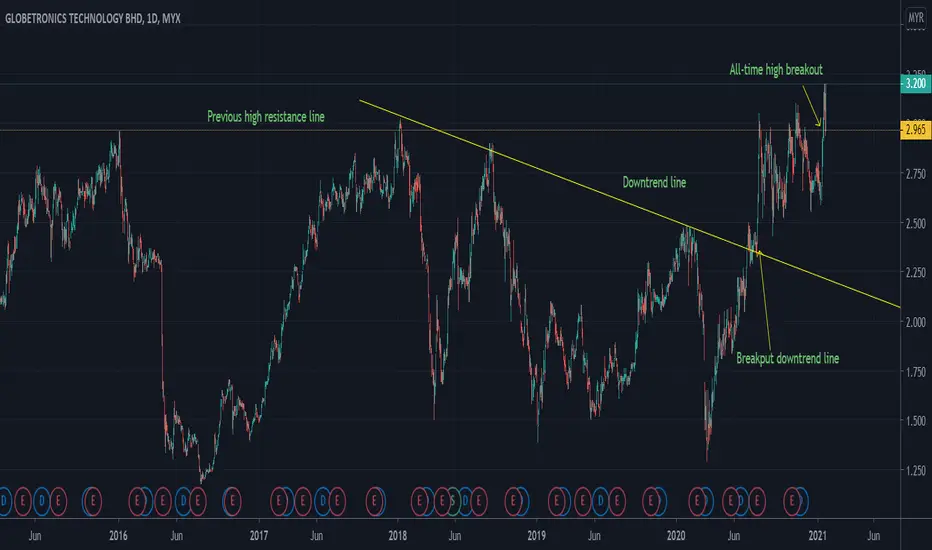
Description: Breakout of strong resistance on 3.00 with high volume build up in since 13 Jan 2021. Expect GTRONIC to continue moving higher if stock price can stay above 2.95.
GTRONIC trade ideas

GTRONIC's Tectonic MoveCorporate Name : GLOBETRONICS TECHNOLOGY BERHAD
Symbol & Code : GTRONIC (7022)
Board : MAIN
Shariah : Compliant
Sector : Technology
Sub-Sector : Semiconductors
• Weekly: GTRONIC has just attained 5years all time high. Hopefully price remains above 2.96
• Daily: GTRONIC entered Stan Weinstein’s Stage 2 Market Stage, proceeded into retracement and then the price break the 50MA and 20MA again
• EP: EP 3-3.1
Gtronic continues uptrending after a successful breakoutAmid the euphoria on tech sector, Gtronic is expected to continue to be bullish for quite sometime. Target TP is 3.500


Globetronic - Ending a 15 day downtrendGtronic has been seeing 15% markdown since early December.
We observe ema 5 is crossing up to ema 20 line soon. Expect this stock to break down trend.
TP is 2.88, EP 2.72-2.76, best EP is 2.73 at strong support. CL is 2.71

GTRONIC - Impulse Pullback To Mean & Wait for the BD FilterBlue Diamond Filter still Red. Wait until it become Green to see if the Pullback is complete.
Please consider your own interpretation of Opportunity & Risk:
NO BUY CALLS OR INVESTMENT ADVISED ARE PROVIDED.
DISCLAIMER: This analysis is for reference and learning purposes only. It is based on my personal view in the market from a technical analysis standpoint. None of information posted in this chart can be used as investment decisions or investment advises to any parties. Do not trade solely on the information posted in this page. Trade at your own risk and judgement. A trader could potentially lose all money. Only risk capital that can be lost without jeopardizing ones financial security of lifestyle. Please seek licensed professional guidance if you plan to invest your capital seriously.
PENAFIAN: Analysis ini hanyalah untuk tujuan rujukkan dan pembelajaran sahaja dan bukan cadangan untuk membeli atau menjual stok atau apa jua jenis instrumen kewangan. Anda dinasihatkan untuk menghubungi remieser / dealer / bank pelaburan yang mempunyai lesen atau kelayakan yang sah untuk bertanyakan pendapat dan menguruskan pelaburan anda. Pelaburan dan perdagangan mempunyai risiko tinggi, dan ianya adalah Risiko Anda Sendiri.


KLSE: GTRONIC - Coiling for a breakoutA Malaysian semiconductor stock listed on the KLSE, coming towards the upper boundary of a 5-year consolidation pattern.
Depending on how you draw it, it could be a rectangle or an ascending triangle - no matter, the pattern is bullish at this point in time.
The icing on the cake is the small symmetrical triangle forming on the daily chart, which will work nicely as a launching pattern once there is a breakout.


GTRONIC 31/7/2020Ascending triangle breakout earlier. Looks like a premature breakout. Nonetheless, it closed at above resistance turn support line. Will need to monitor to see if it will fall back further for potential entry.


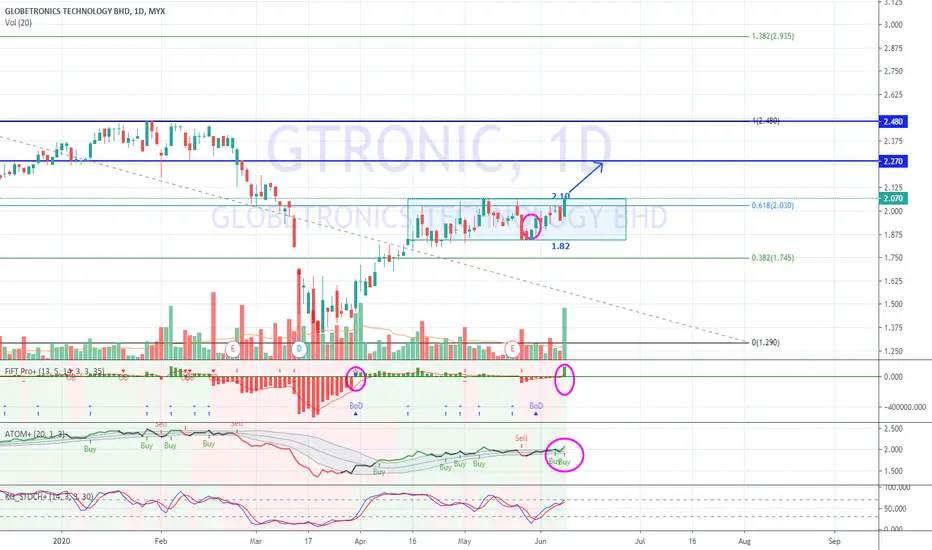
Is GTRONIC ready to breakout ? GTRONIC close with strong BULLISH candle with significant Volume.
ATOM is Buy and FiFT turned +ve
Breaks above 2.10 will trigger slow turtle BUY
Expect strong breakout considering GTRONIC has been consolidating for about 2 months since mid april (similar to Inari)
Monitor to further buy upon breakout


MY - Gtronic - Hit TP2Gtronic hit TP2.
Break 1 month high with convincing volume.
Next target 2.6 and 2.8
Hold.

GTRONIC risk reward ratio 3Kaunter dalam sektor teknologi.
Volume besar cancel out retracement, mungkin tiba masa untuk reversal.

GTRONIC, Consolidating After a Breakout; A Trend Begets a Trend?Bias: Short term consolidation (pennant), with moving averages (MA) in bullish formation.
Stop-loss: 2.00
// This region is the breakout point of the previous resistance, as well as whole number psychology effect.
1st target: 2.27
// Previous high as minor resistance.
2nd target: 2.46
// Projected target from fibonacci extension as well as major resistance region.
Gentle reminder: Plan the trade and trade the plan. Trade at your own risk. Stay tune!
Guys, if you like the idea, please "like" it, this will be the best thanks.
If you have any questions or trading ideas, please post them in comments!
Thank you for your support, we appreciate it.
We also offer coaching lessons, PM for details.
Public Telegram Group: t.me
Our Facebook Page: www.facebook.com

<TradeVSA> Pullback in Gtronic & Gtronic-C3Strength in the chart:
1. Sideways accumulation
2. Line change above Up-thrust
Hit the "LIKE" button to support us :)
Disclaimer
This information only serves as reference information and does not constitute a buy or sell call. Conduct your own research and assessment before deciding to buy or sell any stock

Head and Shoulders forming on GTRONIC?Price plunged after bad quarter results, a rebound might be seen with resistance of RM2.16, a head and shoulders formation might be forming.

GTRONIC - Heikin Ashi AnalysisAfter recent sideway breakout it looks like some profit taking is underway. Looking at the Heikin Ashi candlestick chart however it seems like there is still hope that this will be a successful pullback. US technology stocks are also looking green with Apple reaching all time high and Intel showed promising result. Probably Bursa tech stocks will rally next week? Let's wait and see.

GTRONIC BULLISH(JUST BREAKOUT!!)1. VOLUME SUPERB INCREASE
2. MA 50,200 CROSS-> STRONG BULLISH WILL COME
3. FOR FA,ADVANTAGE OF US-CHINA TRADE WAR
