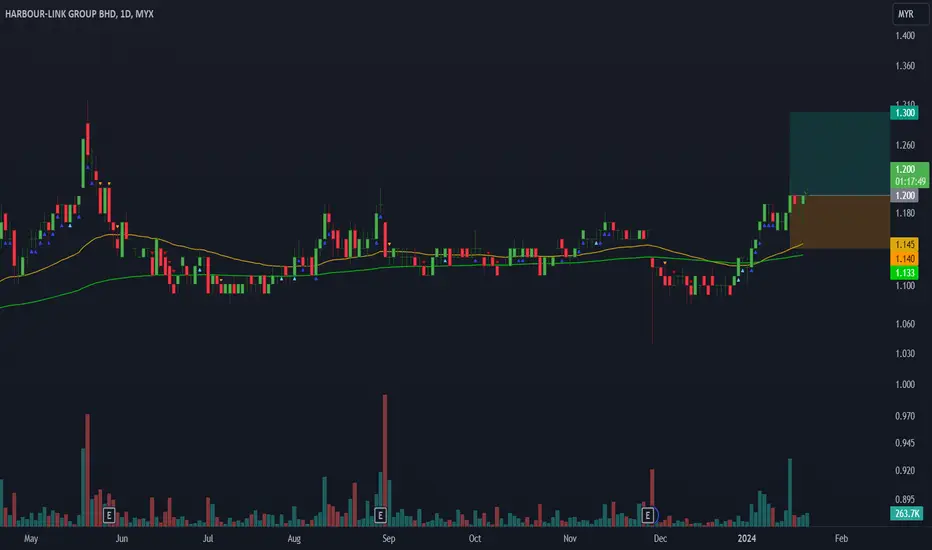
HARBOUR, Uptrend based on AlgoSignal StrategyThe current point exhibits promising upward signals according to my algorithmic system, meeting various criteria. These include rising trading volume, an upward trend indicated by prices above EMA20 and EMA50, and the closing price surpassing VWAP. As a result, the present conditions suggest a poten
0.27 MYR
86.19 M MYR
941.63 M MYR
88.87 M
About HARBOUR-LINK GROUP BHD
Sector
Industry
CEO
Piaw Soon Yong
Website
Headquarters
Bintulu
Founded
1975
ISIN
MYL2062OO007
FIGI
BBG000BDTW15
Harbour-Link Group Bhd. is an investment holding company, which engages in the provision of management services. It operates through the following segments: Investment Holding, Shipping and Marine Services, Integrated Logistics, Machineries Trading, Engineering Works, and Property Development. The company was founded by Siong Seh Wong and Piaw Soon Yong in 1975 and is headquartered in Bintulu, Malaysia.
Related stocks
Triple fan pending breakoutVery clear triple fan trendline. After breaking out third trendline, it’s gonna be bullish.
Not a buycall. TAYOR.

Short term target1.12 Resistance has been broken.
Next Resistance will be the next target 1.30.
DYOR.

LOW CHEAT SETUP HARBOURFundamental,losing in QOQ but profitting in YOY.Price has broken the horizontal on 9feb,however retrace back to give oppurtunity to buy lower.Now back up to the horizontal line.Watchout for a breakout with high volume.


BO1. BO pada chart daily & weekly
2. BBD positif utk 3 TF weekly, daily & hourly.
3. Kemungkinan mencari 52wk higt 1.73
4. jika price drop, jadikan 1.30 sebagai RBS


HARBOUR IN HARMINIC PATTERNHARBOUR spotted in pennant formation and bat harmonic pattern where a potential swing trade can be taken to Point D.


HARBOUR in ABC formationHARBOUR rebounded from EMA200 and fibo786.
Probable EP is at 1.110 to retest fibo786.
Probable TP would be at daily central pivot and psychological price at 1.300.
Probable CL is tight, that is, below recent swing low S1.
This is for monitoring and study purposes only and not an investment call.

See all ideas
Summarizing what the indicators are suggesting.
Oscillators
Neutral
SellBuy
Strong sellStrong buy
Strong sellSellNeutralBuyStrong buy
Oscillators
Neutral
SellBuy
Strong sellStrong buy
Strong sellSellNeutralBuyStrong buy
Summary
Neutral
SellBuy
Strong sellStrong buy
Strong sellSellNeutralBuyStrong buy
Summary
Neutral
SellBuy
Strong sellStrong buy
Strong sellSellNeutralBuyStrong buy
Summary
Neutral
SellBuy
Strong sellStrong buy
Strong sellSellNeutralBuyStrong buy
Moving Averages
Neutral
SellBuy
Strong sellStrong buy
Strong sellSellNeutralBuyStrong buy
Moving Averages
Neutral
SellBuy
Strong sellStrong buy
Strong sellSellNeutralBuyStrong buy
Displays a symbol's price movements over previous years to identify recurring trends.
Frequently Asked Questions
The current price of HARBOUR is 1.28 MYR — it has decreased by −0.78% in the past 24 hours. Watch HARBOUR-LINK GROUP BHD stock price performance more closely on the chart.
Depending on the exchange, the stock ticker may vary. For instance, on MYX exchange HARBOUR-LINK GROUP BHD stocks are traded under the ticker HARBOUR.
HARBOUR stock has fallen by −1.54% compared to the previous week, the month change is a −2.29% fall, over the last year HARBOUR-LINK GROUP BHD has showed a −15.79% decrease.
HARBOUR reached its all-time high on Jun 11, 2024 with the price of 1.84 MYR, and its all-time low was 0.006818 MYR and was reached on Jan 3, 2003. View more price dynamics on HARBOUR chart.
See other stocks reaching their highest and lowest prices.
See other stocks reaching their highest and lowest prices.
HARBOUR stock is 2.34% volatile and has beta coefficient of 0.85. Track HARBOUR-LINK GROUP BHD stock price on the chart and check out the list of the most volatile stocks — is HARBOUR-LINK GROUP BHD there?
Today HARBOUR-LINK GROUP BHD has the market capitalization of 510.18 M, it has increased by 1.55% over the last week.
Yes, you can track HARBOUR-LINK GROUP BHD financials in yearly and quarterly reports right on TradingView.
HARBOUR net income for the last quarter is 27.03 M MYR, while the quarter before that showed 29.03 M MYR of net income which accounts for −6.87% change. Track more HARBOUR-LINK GROUP BHD financial stats to get the full picture.
HARBOUR-LINK GROUP BHD dividend yield was 3.77% in 2024, and payout ratio reached 27.75%. The year before the numbers were 5.17% and 16.18% correspondingly. See high-dividend stocks and find more opportunities for your portfolio.
As of Aug 2, 2025, the company has 2 K employees. See our rating of the largest employees — is HARBOUR-LINK GROUP BHD on this list?
EBITDA measures a company's operating performance, its growth signifies an improvement in the efficiency of a company. HARBOUR-LINK GROUP BHD EBITDA is 173.75 M MYR, and current EBITDA margin is 16.77%. See more stats in HARBOUR-LINK GROUP BHD financial statements.
Like other stocks, HARBOUR shares are traded on stock exchanges, e.g. Nasdaq, Nyse, Euronext, and the easiest way to buy them is through an online stock broker. To do this, you need to open an account and follow a broker's procedures, then start trading. You can trade HARBOUR-LINK GROUP BHD stock right from TradingView charts — choose your broker and connect to your account.
Investing in stocks requires a comprehensive research: you should carefully study all the available data, e.g. company's financials, related news, and its technical analysis. So HARBOUR-LINK GROUP BHD technincal analysis shows the strong sell today, and its 1 week rating is sell. Since market conditions are prone to changes, it's worth looking a bit further into the future — according to the 1 month rating HARBOUR-LINK GROUP BHD stock shows the neutral signal. See more of HARBOUR-LINK GROUP BHD technicals for a more comprehensive analysis.
If you're still not sure, try looking for inspiration in our curated watchlists.
If you're still not sure, try looking for inspiration in our curated watchlists.