HENGYUANsideways
play box to box
long to above RM 4
long resistance RM7
looking to breakout box to box and uptrend wave
HENGYUAN trade ideas

Hengyuan Simple Chart AnalysisMonitor for a possible retracement ended here to breakout. As long there is an energy trend on going, it will be a good move for aggressive trader.
The Sign of Warning is Here for HengYuan ?Sign of Weakness in the chart:
1. Buying Climax with Up-Thrust high volume
2. Sell-Off bar in hourly chart
Disclaimer
This information only serves as reference information and does not constitute a buy or sell call. Conduct your own research and assessment before deciding to buy or sell any stock

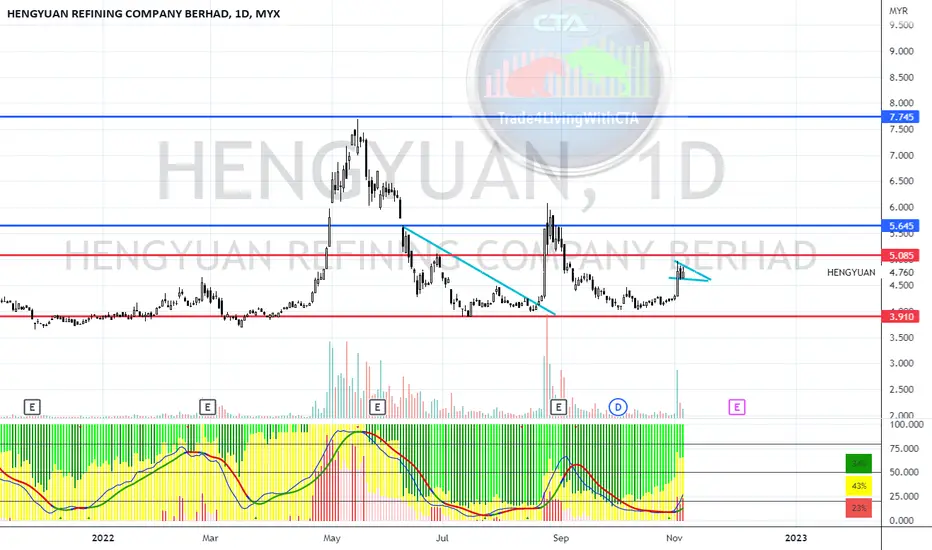
HENGYUAN 4324 bursa saham malaysia stock analysis 14-May-2022Short term analysis:
Price comes to previous high range of 7.00 dated 08-Dec-2020
1) Price has divergence with Bull Bear Detector (BBD) : higher price but lower BBD candle
2) Price has divergence with Smart Money Flow (MI02b) indicator : higher price but RED bar in MI02b (profit chip) getting lesser,
this may indicates traders are selling off for profit!
Mid term preparation:
Wait for price to break above 7.00 previous high resistance to continue the uptrend momentum
#bursasaham #malaysiastockmarket #hengyuan #4324 #bursamalaysia #malaysia #bursa
#trendline #trendanalysis #technicalanalysis #chartpattern #trendpattern #uptrend #divergence
#supportresistance #technicalindicator #indicator #waveanalysis
Disclaimer:
This published Idea is solely for the purpose of education and opinion sharing, and should not be construed as investment advice or recommendations to buy or sell any security.
Get your trade advise from a legit broker, you are responsible on your own trade.

CHEAT SETUP HENGYUANAffect from sentimen,as Russia attacks Ukraine.Break above horizontal line with high volume
HENGYUAN INVERTED HEAD AND SHOULDERSConsider to study and monitor HENGYUAN spotted in inverted head and shoulder and bat formations.

HENGYUAN TECHNICAL ANALYSISTechnical analysis for HENGYUAN Stock based on Trend Analysis, Chart Pattern and VPA

Rare Bullish Tri-Star has formedRare Bullish Tri-Star has formed,
Above all Moving Average,
Lower High,
Higher High
MACD above 0

(EL) Trend Rider 151. Weekly in Wave 4 retraced at 0.5 with also RBS. Candlestick reversal signal at D1 and H4.
2. EMA 10>EMA 30. EMA 200 broke.
3. Bursa Marketplace rating 5, Isaham 7.7, i3 ATP none. Oil and gas may not be in theme yet but expected to be soon.

HENGYUAN - Consolidation PhaseHENGYUAN
Theme: Energy
Rst: 5.43
Spp: 5.16
Slightly adjustment to the lower band of pennant formation, apparently the latest 6 candles remain sustain at this area, no breakdown happens yet. Overall neutral.

HENGYUAN - Pre Consolidation BreakoutNO INVESTMENT ADVICE IS PROVIDED
DISCLAIMER
Please consider your own interpretation of Opportunity & Risk. The author of this post strictly follows the Malaysian Security Commission ( SC ) Guidelines on the prohibition of Investment Advice by unlicensed parties. Any examples shall use historical charts without any recommendations and not to cause inducement to the public to take action or position (e.g. buy, sell or hold) regarding a particular class, sector, or instrument in relation to securities or derivatives. The author will never provide any investment or trading advice as the activity of giving investment advice is likely to be considered as a regulated activity under the Capital Markets and Services Act 2007 ( CMSA ). All posts made in Tradingview do not include any communications involving providing recommendations or opinions or includes any material, content or any statement which are likely to induce a person to take any action or position (e.g. buy, sell or hold) regarding a particular class, sector, or instrument in relation to securities or derivatives that is likely to be considered as “advising others concerning securities or derivatives”. The author will not recklessly make any statement, promise or forecast that is misleading, false or deceptive to induce or attempt to induce another person to deal in securities or derivatives. None of information posted in post can be used as investment decisions. Do not trade solely on the information posted. Trade at your own risk and judgement. A trader could potentially lose all money. Only risk capital that can be lost without jeopardizing ones financial security of lifestyle. Please seek licensed professional guidance if you plan to invest your capital seriously.


Hengyuan Continue Momemtum?MYX:HENGYUAN
Slow Turtle Buy
FiFT +ve
Atom Buy starting move above river
MCDX+ Banker Turn Strong
Banker 25% +


Monitor - HengyuanUptrend, Bullish and Strong Bull.
Last friday gap up ended with Doji at 6.
MCDX Banker only 36% but retailer volume reduce to just 15%
Hotmoney around 50% indicating that HY is on sideway move.
Banker Moving Average still sloping down suggesting that retracement not yet done
Slow turtle support is 4.8, 5-day low is 5.4
Take profit zone around 7 to 7.3
Long term profit zone around 9.2
Plan to Buy at support considering HY is on sideway move :-
1) Buy at gap close 5.8 or
2) Wait for price action and signal around 5.4 - 5.5 support.
3) Take some profit at 7 - 7.3
4) TP2 around 9.2 or Hold if price remain above ATOM river or Retailer% = 0%

HENGYUAN LEADER OIL & GASOngoing 3rd ew.
Price may approaching 10.30 to 11 but need close monitoring

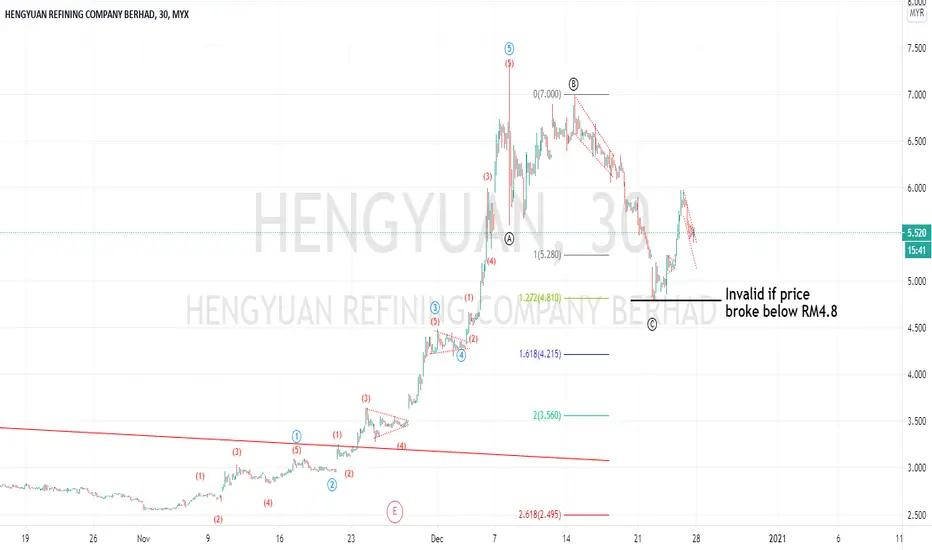
HENGYUAN - UPTREND LIKELY TO RESUME SOONHengyuan, stock is bullish with good uptrend movement since beginning of November with impulse 5 waves up movement. However, the stock took a pause for consolidation since 2 weeks ago. Refer to the chart, there is possibility the stock ends its correction with its ABC waves movement when hit RM4.8 on December 22nd and this price level likely is the pivot point of resuming uptrend.
This analysis will be invalid is price broken below RM4.8. And if happened, will expect more complex correction before resuming uptrend movement.
Consider long.
Happy trading!
Pullback complete for HengyuanPullback complete for hengyuan
made a higher low at RM5
continuation markup trend will be continue


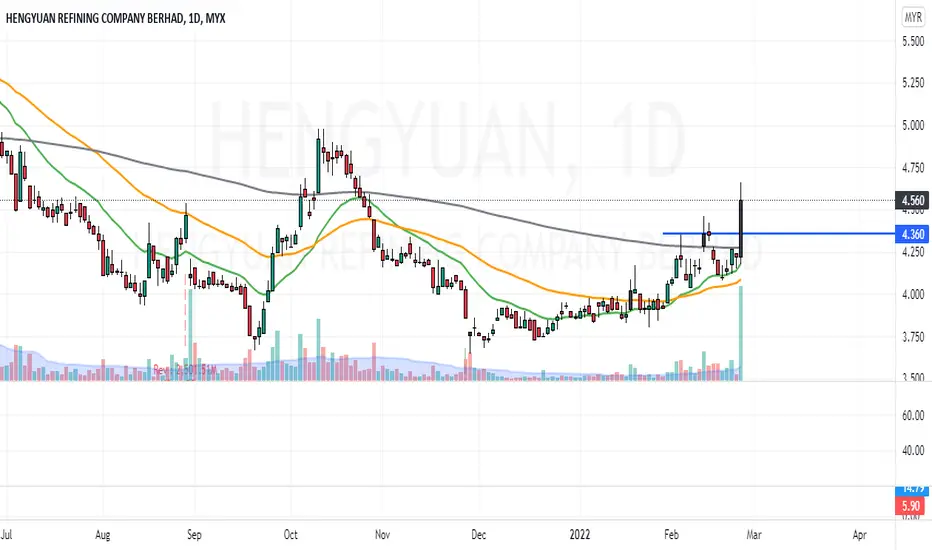
Bullish BreakoutHENGYUAN is strongly bullish, supported by recent close above nearest resistance at 4.3 preceded by a Golden cross and significant movement above the downtrend line. Momentum building up seen on MACD adding our optimism for more upward movement towards Fibonacci target 2.618 at 7.65, coincides resistance level in 2018. However, the price will meet resistance at Fibonacci level 1.618 on the way up. On the flipside, closing price below 2.5 would push the price lower.
Disclaimer: The content on this analysis is subject to change at any time without notice, and is provided for the sole purpose of assisting traders to make independent investment decisions.

