MY: Hevea Analysis 24/11/23Market in sideways at the moment after a drop. Target Long position for long term. Expecting a 100% from current price but its a long term target. High Risk can buy partially, low risk can wait at support to buy.
P/s: Not a Buy / Sell call. Please due diligence before enter any trade.
Next report date
—
Report period
—
EPS estimate
—
Revenue estimate
—
−0.015 MYR
−5.06 M MYR
327.30 M MYR
356.30 M
About HEVEABOARD BHD
Sector
Industry
CEO
Hau Chun Yoong
Website
Headquarters
Gemas
Founded
1993
ISIN
MYL5095OO004
FIGI
BBG000QPHBN7
HeveaBoard Bhd. is an investment holding company which engages in the manufacture, trade and distribution of particleboard and particleboard-based products. It operates through the following segments: Particleboards, Ready-to-Assemble Products, Cultivation and Trading of Gourmet Fungi, and Others. The Particleboards segment manufactures and trades particleboards and other panel boards. The Ready-to-Assemble Products segment refers to the manufacture and trade of ready-to-assemble furniture. The Cultivation and Trading of Gourmet Fungi segment involves in the business of cultivation and trading of gourmet fungi. The Others segment includes the business of cultivation and trading of fungi and investment holding. The company was founded on September 3, 1993 and is headquartered in Gemas, Malaysia.
Related stocks

HEVEA : Filter 3 has appearedOn the 16th of Aug Filter 3 appeared but the following candles failed to break filter 3 high and started the pullback.
Today it seems the pullback has completed.
If the price breaks 0.345 (1 month high), it will be more likely to create new higher high.
TAYOR.

Potential +50% Gain from PullbackSign of Strength in the chart:
1. Accumulation in Weekly Chart
2. Pullback Completed with Green Pentagon
Disclaimer
This information only serves as reference information and does not constitute a buy or sell call. Conduct your own research and assessment before deciding to buy or sell any stock

<TradeVSA> Bullish Setup in Furniture ?Case Study:
1. Lii Hen
2. Poh Huat
3. Hevea
Signal in the chart:
1. Downtrend in weekly chart
2. Reversal with uptrend in daily chart
3. Green Pentagon Signal
4. NS signal above 20/40ma
Disclaimer
This information only serves as reference information and does not constitute a buy or sell call. Co

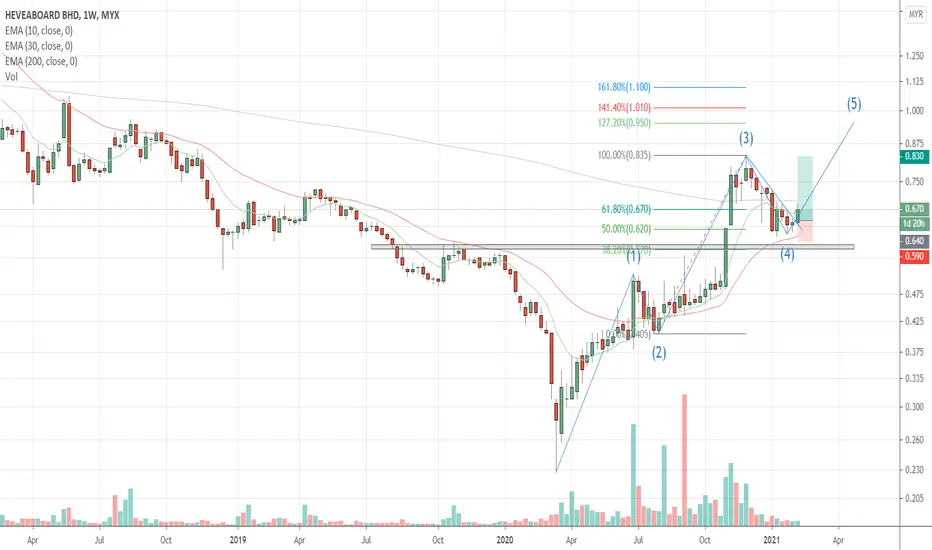
Trend Rider 171. Weekly chart EMA 10>EMA 30 but below EMA 200. Expected to break soon.
2. Now in Wave 4, reversal can be seen at H4 and D1 at level 0.5. Wave 2 reversal at 0.618.
3. Bursa Marketplace rating 8 (Earn 10) target price 0.74, isaham 8.2, i3 ATP RM0.55 (latest RM0.83).
HEVEABOARD's wave 3 is coming soonIt might completed wave 2 and heading to wave 3 soon in weekly timeframe!
Watch out your stock here !
Is all about elliott wave analysis
✅ naked chart analysis, ❌ indicator
(Disclaimer: for demonstrate own planned trade records study only and education purpose, not for recommend to buy or sell.


HEVEA : Possible rebound at 0.640Previously, HEVEA rebound at that price but need to monitor lumber price for its reference.

HEVEA Creating Higher Highs and Higher LowsEntry: 0.73 - 0.735
Support: 0.720
Cutloss: 0.690
TP1/TP2: 0.78 - 0.815
Not buycall / Personal study only / TAYOR

Forecast MYX:HEVEAChart menunjukkan kaunter sedang berada di dalam trend menaik (uptrend). Jika menggunakan kiraan Elliott Wave, ianya sedang membentuk wave ke 4. Secara teori-nya, wave 4 adalah correction wave yang mana harga akan membuat penurunan sebelum meneruskan kenaikan.
Walau bagaimanapun, ini adalah analisi

See all ideas
Summarizing what the indicators are suggesting.
Neutral
SellBuy
Strong sellStrong buy
Strong sellSellNeutralBuyStrong buy
Neutral
SellBuy
Strong sellStrong buy
Strong sellSellNeutralBuyStrong buy
Neutral
SellBuy
Strong sellStrong buy
Strong sellSellNeutralBuyStrong buy
An aggregate view of professional's ratings.
Neutral
SellBuy
Strong sellStrong buy
Strong sellSellNeutralBuyStrong buy
Neutral
SellBuy
Strong sellStrong buy
Strong sellSellNeutralBuyStrong buy
Neutral
SellBuy
Strong sellStrong buy
Strong sellSellNeutralBuyStrong buy
Displays a symbol's price movements over previous years to identify recurring trends.
Frequently Asked Questions
The current price of HEVEA is 0.225 MYR — it hasn't changed in the past 24 hours. Watch HEVEABOARD BHD stock price performance more closely on the chart.
Depending on the exchange, the stock ticker may vary. For instance, on MYX exchange HEVEABOARD BHD stocks are traded under the ticker HEVEA.
HEVEA stock hasn't changed in a week, the month change is a −2.17% fall, over the last year HEVEABOARD BHD has showed a −32.84% decrease.
We've gathered analysts' opinions on HEVEABOARD BHD future price: according to them, HEVEA price has a max estimate of 0.22 MYR and a min estimate of 0.22 MYR. Watch HEVEA chart and read a more detailed HEVEABOARD BHD stock forecast: see what analysts think of HEVEABOARD BHD and suggest that you do with its stocks.
HEVEA reached its all-time high on Jan 6, 2016 with the price of 1.790 MYR, and its all-time low was 0.015 MYR and was reached on Mar 4, 2009. View more price dynamics on HEVEA chart.
See other stocks reaching their highest and lowest prices.
See other stocks reaching their highest and lowest prices.
HEVEA stock is 2.27% volatile and has beta coefficient of 0.72. Track HEVEABOARD BHD stock price on the chart and check out the list of the most volatile stocks — is HEVEABOARD BHD there?
Today HEVEABOARD BHD has the market capitalization of 127.32 M, it has increased by 2.22% over the last week.
Yes, you can track HEVEABOARD BHD financials in yearly and quarterly reports right on TradingView.
HEVEABOARD BHD is going to release the next earnings report on Sep 2, 2025. Keep track of upcoming events with our Earnings Calendar.
HEVEA net income for the last quarter is −2.38 M MYR, while the quarter before that showed 3.64 M MYR of net income which accounts for −165.46% change. Track more HEVEABOARD BHD financial stats to get the full picture.
Yes, HEVEA dividends are paid annually. The last dividend per share was 0.01 MYR. As of today, Dividend Yield (TTM)% is 4.44%. Tracking HEVEABOARD BHD dividends might help you take more informed decisions.
As of Aug 5, 2025, the company has 1.96 K employees. See our rating of the largest employees — is HEVEABOARD BHD on this list?
EBITDA measures a company's operating performance, its growth signifies an improvement in the efficiency of a company. HEVEABOARD BHD EBITDA is 6.18 M MYR, and current EBITDA margin is 2.79%. See more stats in HEVEABOARD BHD financial statements.
Like other stocks, HEVEA shares are traded on stock exchanges, e.g. Nasdaq, Nyse, Euronext, and the easiest way to buy them is through an online stock broker. To do this, you need to open an account and follow a broker's procedures, then start trading. You can trade HEVEABOARD BHD stock right from TradingView charts — choose your broker and connect to your account.
Investing in stocks requires a comprehensive research: you should carefully study all the available data, e.g. company's financials, related news, and its technical analysis. So HEVEABOARD BHD technincal analysis shows the sell today, and its 1 week rating is sell. Since market conditions are prone to changes, it's worth looking a bit further into the future — according to the 1 month rating HEVEABOARD BHD stock shows the sell signal. See more of HEVEABOARD BHD technicals for a more comprehensive analysis.
If you're still not sure, try looking for inspiration in our curated watchlists.
If you're still not sure, try looking for inspiration in our curated watchlists.