HEXTAR RE-ENTRYprevious entry flushed out
position re-initiated as attached
pure wyckoff
refer my previous anlysis regarding hextar
HEXTAR trade ideas

HEXTAR ABSORPTIONwith current price action showing BUEC in action,
it looks like trade about to happen in view of Absorption in progress
would be there an explosive upward?
trade initiated as shown
PURE WYCKOFF


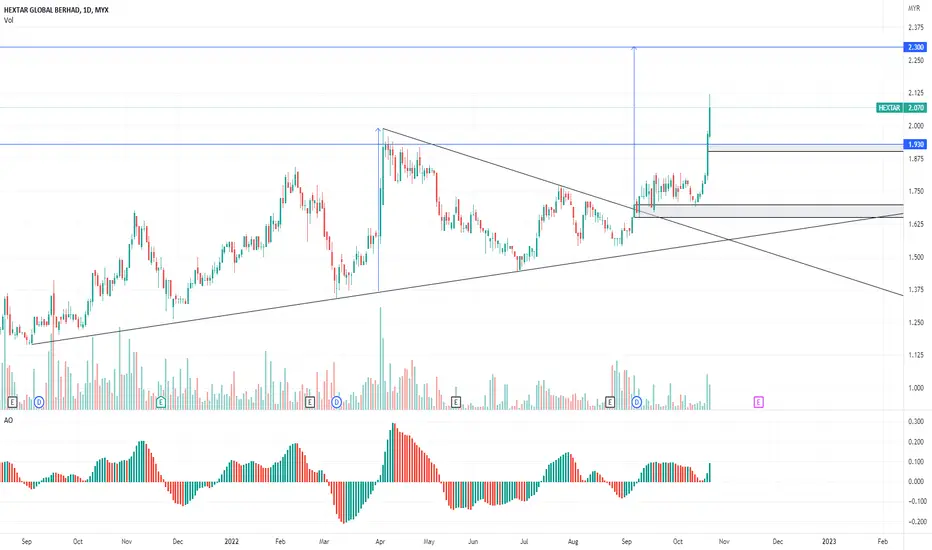
HEXTAR: IMMEDIATE TARGET 2.3 Price manages to make new ATH with pure breakout.
Immediate target: 2.3 (symmetrical triangle vertical target)
Current RBS is 1.93, previous ATH, if monitor closely in H1, RBR demand zone is seen at the same level. Worth to monitor for pullback at that zone.
*Personal opinion, trade at your own risk*

TP IDEA FOR HEXTARPure breakout ATH with huge volume. immediate target using vertical range at 2.3. RBs at 1.93 confluence demand zone in H1
HEXTAR VCP AGAIN!! HEXTAR was one of my best trade in 2021 with a compound % gain of 74%!
All 3 trades back then in 2021 were just using VCP. You guys can see the link below that i shared last year Jan 2021, July 2021. I didn't share on TradingView during November 2021 setup but I do trade and update members in my weekly stock pick.
AGAIN, VCP is developed since April 2022 with 4 contraction below:
C1: -25%
C2: -12%
C3: -5%
C4: -5%
HEXTAR start caught my attention during C3 area after QR was released. C4 looks rigid. The price/volume setup was crispy. Let's see.
Disclaimer:
Information presented here is not intended to be used as the sole basis of any investment decisions nor should it be construed as advice designed to meet the investment need of any investor. Trade at your own risk.

HEXTAR - NS Signal near Support LevelSign of Strength in the chart:
1. Shakeout completed
2. Re-test support successfully with NS signal
Disclaimer
This information only serves as reference information and does not constitute a buy or sell call. Conduct your own research and assessment before deciding to buy or sell any stock

Hextar Global - Brusa MalaysiaSelling zones for CO due to super high volume in middle and high range. If its bullish the demand should have higher volume at the bottom cos its accummulating. This looks like distribution character.
Bias to the downside preferred with target 1.280. SL 1.620 local high for invalidation.

LOW CHEAT SETUP HEXTARIncreasing EPS QOQ and YOY.Price just break the horizontal line with high volume

Post-Trade Analysis8% profit
-price dah sampai 15% dari BO place
-ADR (volatility),
drop from green to red line (range 2.5 - 2.9)
indicate supply = demand
-RSI>50 = strong uptrend momentum
-RS>0 = strong stocks compared to FBMKLCI
characteristics:
1st drop < 35%, last low cheat < 15% from top
monitor closely when it has small range,
Remember: volume come first before price!!
bukan supply test: if long uppter tail,
tapi bukan at resistance area/zone

$HEXTAR - Repetitive Pattern$HEXTAR - As per chart , the repeating chart pattern - BO on pennant or triangle Pattern or BO DTL on uptrend channel

CHEAT SETUP HEXTARQuite extended from 1st initial uptrend breakout.Fundamental also showing loss for 3 consecutive quarter report.Setup is there,but be cautious,eventhough price already retest the previous cheat setup (horizontal line)

<TradeVSA> Continuation in Trend for HEXTAR ?Sign of Strength in the chart:
1. Reaccumulation with Pocket Pivot
2. Positive Market Stages with Support
3. Green Pentagon with Spring as Pullback
Disclaimer
This information only serves as reference information and does not constitute a buy or sell call. Conduct your own research and assessment before deciding to buy or sell any stock

HEXTARGOODLUCK TRADERS
TRADE AT YOUR OWN RISK
buy at the support will be recommended!!!
“Compound interest is the eighth wonder of the world. He who understands it, earns it. He who doesn’t, pays it.” — Albert Einstein
JUST MY OPINION!
NOT A FINANCIAL ADVISE!!

Trade for ContraLooking Good to take from the reversal . For KLSE stocks intra day and contra day trading for Target and Stop loss
Text me in whats app +91 73138 16218
Since its commencement in 1985, the Hextar brand has been marking its place as one of Malaysia’s foremost agrochemical companies. Today, the Hextar Group is a leading crop management solutions provider, both domestically and globally, thanks to its specialised agrochemical products supply chain. From research and development, to manufacturing and distribution, Hextar has consistently provided new and improved superior agrochemical products to its customers.

DARVAS BOX SETUP HEXTARFundamentally out.But technically just broke out from consolidation (box),with high volume.Lets see how it goes after this

HEXTAR TECHNICAL ANALYSISTechnical analysis for HEXTAR Stock based on Trend Analysis, Chart Pattern and Fibonacci Retracement

Remains BullishHextar has been a one-year-rally. However, the share has been working lower for a pullback from ATH at 1.35, forming a pennant pattern. A breakout above this pattern suggest that the continuation trend is intact and the price should witness buying momentum at higher level. As such, the share may head north to test the next resistance of 1.39, followed by 1.52. Meanwhile, a reversal below S1 at 1.17 would negate this expectation.
Disclaimer: No trading strategy provided here. Our content is intended to be used and must be used for technical analysis education purposes only

HEXTARThis stock with momentum is generated using a FIFO B signal with a build-up in trading volume and price.
This is not a buy or sell recommendation. It merely tells you which this stock is seeing higher potential to move uptrend with relatively strong momentum.
The share price may move up or down from this point. Note also that momentum generally only persists for a short period of time.
However, this stock has an accompanying fundamental score and valuation score to help readers evaluate the attractiveness of the stocks if they want to ride the momentum.

HEXTAR (KLSE 5151) Industrial Products & Services | ChemicalsHextar is observed formed a pennant chart pattern breakout today.
Take note: Earning result will be announce in coming day.

HEXTAR: WILL IT CONTINUE THE UPTREND CYCLE?Hextar is still on the uptrend cycle. I'm expecting it will move forward to test the near-resistant level in the coming days.
TAYOR!
Hextar is now at its all time high.Hextar price breakout the symmetrical triangle then followed by the breakout of neck line of saucer pattern which is also its all time high.
Next target price is RM1.40.
Please kindly leave comments so that we can learn together.

