HEXTAR trade ideas


HEXTAR - Pre Consolidation BreakoutNO INVESTMENT ADVICE IS PROVIDED
DISCLAIMER
Please consider your own interpretation of Opportunity & Risk. The author of this post strictly follows the Malaysian Security Commission ( SC ) Guidelines on the prohibition of Investment Advice by unlicensed parties. Any examples shall use historical charts without any recommendations and not to cause inducement to the public to take action or position (e.g. buy, sell or hold) regarding a particular class, sector, or instrument in relation to securities or derivatives. The author will never provide any investment or trading advice as the activity of giving investment advice is likely to be considered as a regulated activity under the Capital Markets and Services Act 2007 ( CMSA ). All posts made in Tradingview do not include any communications involving providing recommendations or opinions or includes any material, content or any statement which are likely to induce a person to take any action or position (e.g. buy, sell or hold) regarding a particular class, sector, or instrument in relation to securities or derivatives that is likely to be considered as “advising others concerning securities or derivatives”. The author will not recklessly make any statement, promise or forecast that is misleading, false or deceptive to induce or attempt to induce another person to deal in securities or derivatives. None of information posted in post can be used as investment decisions. Do not trade solely on the information posted. Trade at your own risk and judgement. A trader could potentially lose all money. Only risk capital that can be lost without jeopardizing ones financial security of lifestyle. Please seek licensed professional guidance if you plan to invest your capital seriously.

A rocket to the moon with almost no pullback?BUY
- There were a few entries after some pullbacks and breakouts at 1.00 and 1.42
- 1.30 was a fake breakout – one might be stopped out if chased the breakout at 1.30 – the base wasn’t strong enough
- Entry at 1.42 after a 39b was the better choice with lower volume which indicates less volatility
SELL
- It’s a bull – let it run and nail down profits accordingly
RATIONALE
- Strong buying with only one red candle for the last 22 days
- However, one needs constant monitoring for a suitable entry for this stock
- A pullback is imminent
- Look for another base and entry
**the analysis is solely for my own references and learning

HEXTAR Technical ViewSpotted this golden stock during end of January 2021 !
I entered at 0.885, but out at 0.935 after 1 week :X, now it hits 1.80 at highest! It's more than 100% in 3 months !
Have set 1.73 as TP on earlier of March and it has passed 1.73 for now.
S: 1.73, 1.65
R: 1.80 (if break, then fly higher, if not then pull-back would be seen)

Past Chart (stage 2 phases) HEXTAR-masuk masa base formation (vcp pattern)
-kenaikan after basing area about 60% until 20/4/2021

Expectation Record HEXTAR for 19 - 23 April 2021Resistance 1 : 1.42
Support 1 : 1.32
Support 2 : 1.18

Expectation Record HEXTAR for 12 -16 April 2021Resistance 1 : 1.42
Support 1 : 1.32
Support 2 : 1.18

HEXTAR - Pre Consolidation BreakoutNO INVESTMENT ADVICE IS PROVIDED
DISCLAIMER
Please consider your own interpretation of Opportunity & Risk. The author of this post strictly follows the Malaysian Security Commission ( SC ) Guidelines on the prohibition of Investment Advice by unlicensed parties. Any examples shall use historical charts without any recommendations and not to cause inducement to the public to take action or position (e.g. buy, sell or hold) regarding a particular class, sector, or instrument in relation to securities or derivatives. The author will never provide any investment or trading advice as the activity of giving investment advice is likely to be considered as a regulated activity under the Capital Markets and Services Act 2007 ( CMSA ). All posts made in Tradingview do not include any communications involving providing recommendations or opinions or includes any material, content or any statement which are likely to induce a person to take any action or position (e.g. buy, sell or hold) regarding a particular class, sector, or instrument in relation to securities or derivatives that is likely to be considered as “advising others concerning securities or derivatives”. The author will not recklessly make any statement, promise or forecast that is misleading, false or deceptive to induce or attempt to induce another person to deal in securities or derivatives. None of information posted in post can be used as investment decisions. Do not trade solely on the information posted. Trade at your own risk and judgement. A trader could potentially lose all money. Only risk capital that can be lost without jeopardizing ones financial security of lifestyle. Please seek licensed professional guidance if you plan to invest your capital seriously.

HEXTAR: Volume/Price AnalysisVolume spike from last 3 days. Since it is close to 52 Week High, I might try and hold on to it and see how it goes.

HEXTAR : Uptrend continue ?6 Mac - Hit highest price
- Still in uptrend pattern
- Stochastic in uptrend in Normal Zone
- MACD line above MACD signal and above 0 = stronger signal
- Strong Momentum
- Jerung at 20%
Note:
- Low accumulation activity. If accumulation activity became higher then distribution mean the stock is strong (Jerung keep the stock)

HEXTAR 4H- THE FLYING SAUCER IN PROGRESSThe rounding bottom pattern is almost completed. Wait for a breakout at level 1.0 Fibo. Patience in waiting for this breakout could eventually yield a substantial profit.

HEXTAR Gap Up Bullish Stock
Monitor for good entry setup and it must stay above the resistance line and current price at all time high


HEXTAR VCP!!!For the past one month, HEXTAR has developed volatility contraction pattern that has 3 contraction with healthy volume and price interaction.
C1: ~20%
C2: ~15%
C3: ~5%
Not yet a buy point. Can monitor this week if these C3 contraction valid support or not.
Disclaimer:
The content is my personal experience sharing through technical analysis point of view. The content can only be used for education purposes and NOT any recommendation for buying or selling stock. Please ask your remiser/dealer for making decision. Trade at Your Own Risk.

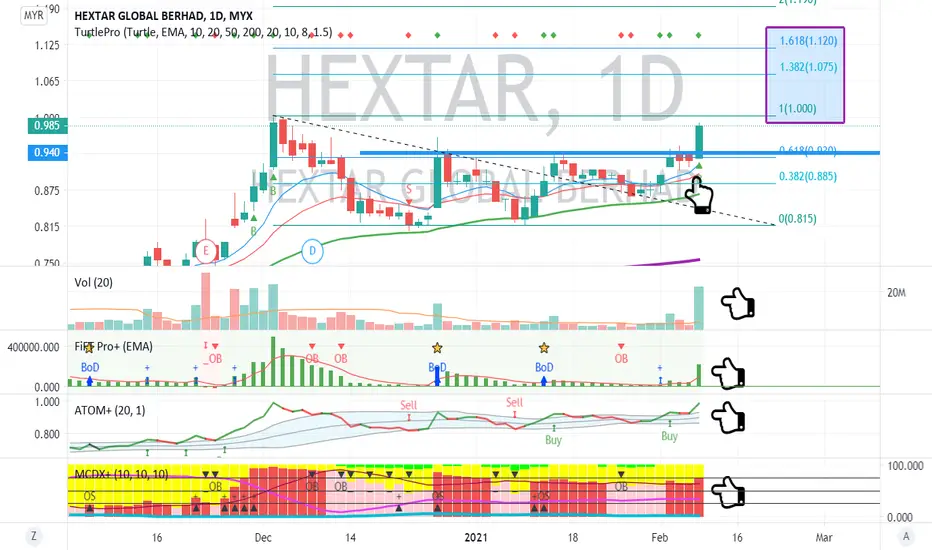
Hextar Breakout Trade ???MYX:HEXTAR
Slow Turtle Buy on Breakout
FiFT Spike up +ve
Atom At highway
MCDX+ Banker 75%
SL below 0.86
HEXTARordinary Bullish MoveCorporate Name : HEXTAR GLOBAL BERHAD
Symbol & Code : HEXTAR (5151)
Board : MAIN
Shariah : Compliant
Sector : Industrial Products & Services
Sub-Sector : Chemicals
• Weekly: Weekly, Hextar would enter stage 2 in less than 1 month. Eye-balling chart is in retracement. HEXTAR is impressive in term of its fundamental analysis.
• Daily: After a gap up, price hovers above a new support and is making a triangle continuation pattern. Try entering in the range of 0.87-0.91
• EP: 0.87-0.91


HEXTAR [9 December 2020] Buy On Dip in Support ZoneMYX:HEXTAR
SWING: 2 DAYS TO 2 WEEKS
Breakout Downtrend Line
52 Weeks High Line
Fibbonaci Retracement
Candlestick Support & Resistant Zone
Trendline Support & Resistant

Hextar climbing the EW waveHextar climbing the EW wave and target based on vertical PnF.
It seems W5 and PnF calc agreed with each other.
TAYOR

Agrochemical is back! Fly high Dec 2020!High momentum nearly 80 (RSI250) and is doing great this week. Good for short and mid term swing, high return!

