MYX: HIAPTEK - Uptrend Continues ?This is purely technical analysis. Repeating wave pattern is in progress. Wave E may last at 93sen. TAYOR.
Abenoor
HIAPTEK trade ideas

FIBO still within 30% to 50% rangeswww.tradingview.com
Potential for a long trade when MA20 crosses up with MA50. Keep monitoring and target price 0.705
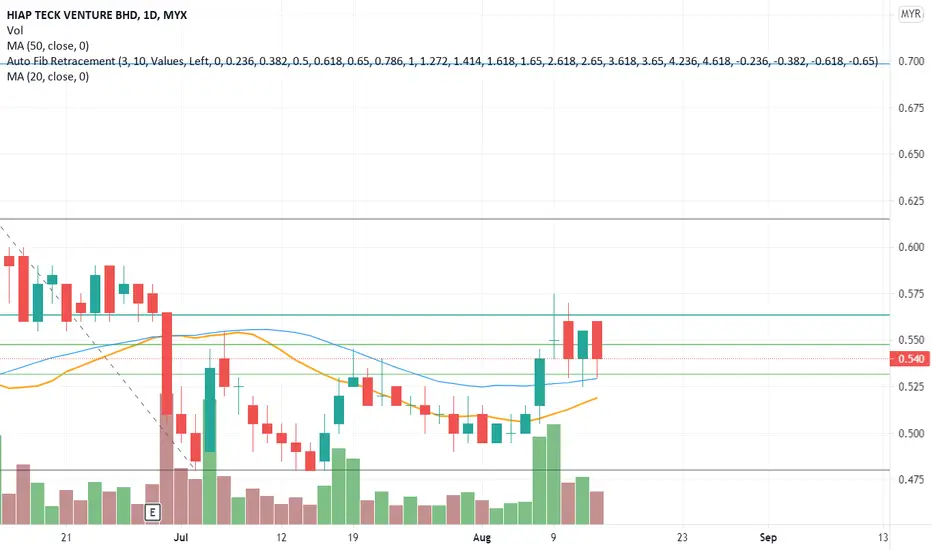
HIAPTEK still holding above MA50www.tradingview.com
HIAPTEK bounce back from support MA50. Next resistance 0.565
Target Price 0.705

Hiaptek to explodeHiaptek has been looking to break out from a descneding triangle for some time now and it seems it is nearly there. Covid scares and political turmoil has slowed this stock down (as shown by decreasing volume), but looking at how the price action is hugging the descending trendline you can see the stock wants to go higher. This would be further backed up by the rapid increase vaccination rate within Malaysia recently, hopefully the construction sector will begin again soon and this will further fuel the stock price increase.
Target price = 0.760
(Set sell order 0.755)

HIAPTEK maybe at last leg up of expanding flat. 31/7/21HIAP TECK ( Steel Products Manufacturer ) probably at the last leg up to complete expanding flat pattern ABC (Red Circled) . BUT price might still having about 80% upside potential..where price could reach at around RM0.930

HIAPTEK VCP SETUPDisclaimer:
Analysis based on my experience and not a buy call recommendation. Trade at your own risk.


TR 101. Weekly EMA 12>36. Broke downtrendline and retrace at the level and also around 0.386. EW can be spotted in which now is in Wave 4.
2. In H4, Hammer formed and broken with a strong bullish candle as a sign of reversal.
3. Price not immediately reverse but goes lower and increase RRR.
4. Bursa Marketplace rating 7, Isaham 4.6, i3 ATP none. High Volume.


Early Buy Signal/Sharp Entry (Intraday)Hi all, here is another idea for today.
You can also apply the Trailing Resistance Indicator on lower Time Frame chart!
As for example, you notice a Buy Signal on DTF , but you are not sure whether its valid or not...
Or you want a more valid/ sharp entry..you can change your chart to a lower TF..
I would suggest TF30...
And the Buy Signal is the same, once the candle (price) crosses up the red line you BUY.
Thats all.

Example of Buy Signal (Early Signal/Intraday Signal)Hi all, here is another idea for today.
You can also apply the Trailing Resistance Indicator on lower Time Frame chart!
As for example, you notice a Buy Signal on DTF, but you are not sure whether its valid or not...
Or you want a more valid/sharp entry..you can change your chart to a lower TF..
I would suggest TF30...
And the Buy Signal is the same, once the candle (price) crosses up the red line you BUY.
Thats all.

Possbile Buy entrylooking for retracement trade long at fibo level 61.8 near previous support at EL 0.53 with target at .0.64 and stop at 0.50

Valid Cup & HandleBullish bias emerged above the Cup and Handle pattern . As such, the stock may head north to test the next resistance of 0.875. Meanwhile, a reversal to below 0.47 would negate this expectation.
Disclaimer: No trading strategy provided here. Our content is intended to be used and must be used for technical analysis education purposes only


Textbook VCP and high price ensues in the future?BUY
- Buy at 510 – textbook VCP pattern – if it’s able to break 535 – there will be more strengths
- However, vcp is not a biblical pattern – market sentiment is important – enough volume during the next few days will push it higher
SELL
- Nail down profits according to your own plan
RATIONALE
- Whole steel sector is doing great
- Took around 140 days to build a base
- Higher RSI might indicate stronger buying hence indicate stronger buying force
**the analysis is solely for my own references and learning


HIAPTEK BOX TRADING ?STAGE 1 BREAKI share ideas to monitor
HIAPTEK
- seems like pending break stage 1 @ broken already
- trying box trading, price should rebound at half candle

Hiaptek Pending Breakout Forming cup pattern. Pending to break above 0.500. Bullish Steel sector as catalyst.

Change of patternAfter the major rise towards the end of 2020, Hiap Tek formed a cup with handle chart pattern, but unfortunately, the breakout was unsuccessful. It seems to be completing the formation of Asending Triangle . Let's see if it manage to do a breakout from the ascending triangle.
MACD indicator showing a potential golden cross could be an indication of a potential breakout.
Disclaimer :
This is by no means a buy call. Please consult your financial advisor for any investment decision.

Cup & Handle Build-up. How will it goes for Hiap Teck?I've been following this stock for a while since its significant rally. From my analysis, the cup&handle pattern is currently near its completion at 90%.
There are few reasons for me in publishing this idea.
First, the sector for this company is steel and metal which are currently uptrending in KLSE. It's good choice for an investor to make a long term investment and a trader to make a short term profit. A counter which attractive to both groups are a good sign for its liquidity.
Second, the background statistics of its financial which consist of its profits and revenue QoQ and YoY shows that it's strong enough and inevitably attracting many investors and traders who looking for some profits.
Thirdly, this stock in a positive side of many indicators. As example, the trend currently above MA50/MA100/MA200 indicates that its generally uptrending. The other indicator is MACD. Even though it's crossed down, note that it's above 0. Shows that weak sell, retracement and probably will rebound in few days. Last indicator supporting this idea is its RSI. Currently at 51.93 which means it's in neutral area and it have more rooms for drastic growth and rally to higher price.
As conclusion, this idea is based on my observation, knowledge and analysis. It's a prediction by considering a few factors from its fundamental and technical informations. There are no 100% success rate for every pattern even a pattern of a breakout new time high. However, an investor and a trader which have vast knowledge can manage their movement to maximize profits and minimize risk.
Disclaimer: This is not a suggestion for purchase and buy actions. Trade and invest on your own risk. This only a shared idea and knowledge at the best platforms. Thank you

