HSSEB,Uptrend based on AlgoSignal Strategy The current point exhibits promising upward signals according to my algorithmic system, meeting various criteria. These include rising trading volume, an upward trend indicated by prices above EMA20 and EMA50, and the closing price surpassing VWAP. As a result, the present conditions suggest a potential upward trend.
HSSEB trade ideas

HSSEB, Uptrend based on AlgoSignal StrategyThe current point exhibits promising upward signals according to my algorithmic system, meeting various criteria. These include rising trading volume, an upward trend indicated by prices above EMA20 and EMA50, and the closing price surpassing VWAP. As a result, the present conditions suggest a potential upward trend.

HSEEB, what is the next move?>> weekly, rebound at FVG, 0930 area, or above EMA 50.
>> Seller in charge base on 1h.
>> Weekly, stochastic still OS.
>> Daily, indicators heading up. Will it be the peak for this round or able to beak the line? Need to break and stay above 103 if want continue rally.
When the market moves where, and how, and if - these are all unknown. The only thing which we can control is our risk. Focus on risk management!
Keep the long term vision.
Disclaimer :
Please be informed that all stocks pick are solely for education and discussion purpose; it is neither a trading advice nor an invitation to trade. For trading advice, please speak to your remisier or dealer representative.

HSSEB displaying a strong bullish trend
1. Price steadily moves within an upward trend framework and consistently bounces back above the MA20, it signifies a robust upward momentum in the price.
2. Relative Strength (RS) indicator portrays a positive trend, indicating that the price has performed better compared to the market index, relatively stronger performance in terms of price movement, suggesting a potential market outperformance.
3. As long as the price remains above MA20, MA50 and support level, the uptrend is expected to persist until there is a clear reversal in the trend.

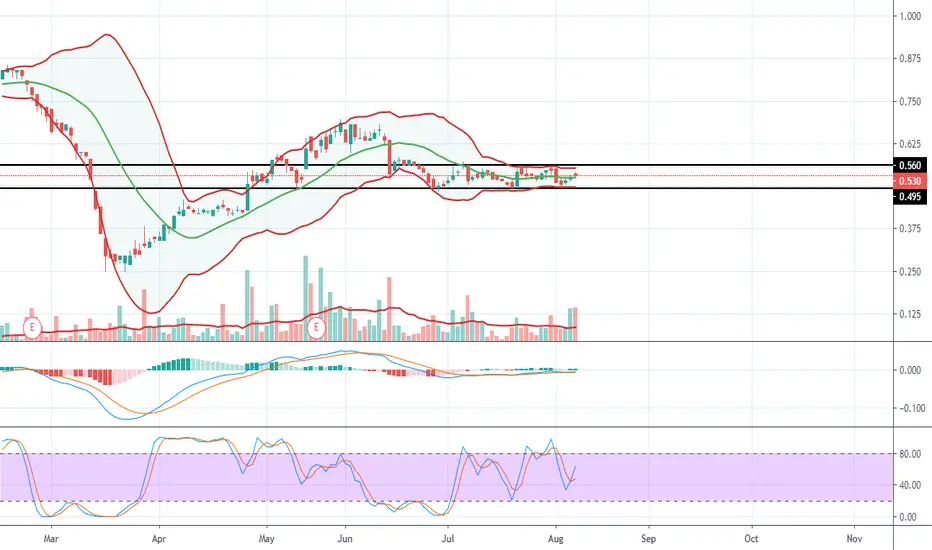
Bullish Divergence spotted on HSSEBBullish divergence spotted on HSSEB chart.
RSI is making higher High while price is sideway.
Trade At Your Own Risk.
This is NOT a BUY/SELL call.


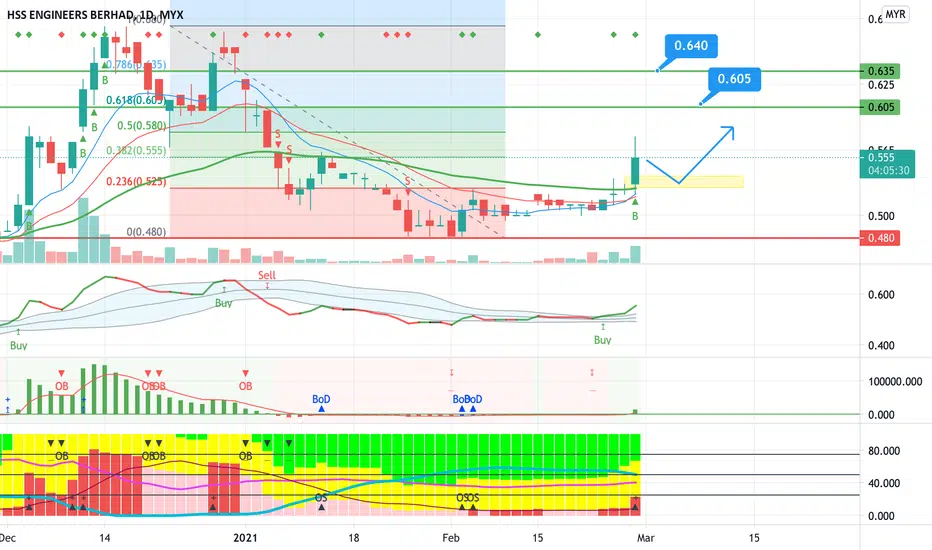
Trading Idea HSSEB (26/02/2021)Trading Idea HSSEB (26/02/2021)
- Buy on dip (yellow zone)
- Target and stoploss as drawn
Disclaimer: This trading idea is strictly intended for informational purposes only so please do your own analysis before making any investment decision.

HSSEB - idea updateNote.
- There is reversal toward previous close.
- Price hasn't finished repairing/ do correction.
- Look for best entry/exit


Mutiple top, HSSEBMovement detected, multiple top has formed. Trying to breakout multiple time but got reject. Looking forward for the breakout price

Training 9/8/2020 - HSSEBAny input @ feedback for me to improves in drawing the chart and writing down my trading plan is really appreciated. Btw, be nice please.. Thank you and have a great trading

HSS - beneficiary of RTS project?Hi,
According to recent news, The JB-Singapore Rapid Transit project is expected to resume. I'm not really good in analysing news, but one of the companies that I read that may benefit from this project is HSS.
Looking at the chart of HSS, there is an appearance of a Wyckoff accumulation phase. (Or is it a re-accumulation?)
We have bar 1 which could be a selling climax ( large down bar with close at the low with ultra high volume)
Then bar 2 was another lower low with slightly above average volume, but price started to oscillate in a trading range after this low.
Bar 3 is a wide spread up bar with higher than average volume )(not excessive volume), and this could be the "Sign of Strength" bar.
According to Wyckoff rule, we wait for Sign of strength to appeared, followed by a Last Point of Support (LPS) for a good entry. If bar 3 was indeed the SOS, then bar 4 would be its LPS.
Bar 4 was interesting in 2 ways : 1) its a down bar with light volume (lesser volume than 2 previous bar) which may indicate a No Supply bar, and 2) the low of bar 4 was a "Spring" setup of the previous two bars, where it broke below the low of the previous 2 bars then closed it back above it.
Trade at your own risk, comments are welcomed.

HSS Engineering Kembali Lagi? (0185.kl)Pemerhatian:
a) Peringkat Pasaran:
- Harga berada pada awal tahap Stage 2 (Mark-Up).
b) Trend Line:
- Harga telah melepasi Downtrend (pertengahan Jul - pertengahan Sep'19).
- Harga disokong pada aras 75.5sen sebelum ia melonjak naik.
c) Harga & Volume:
- Walaupun terdapat tanda-tanda SOW, namun harga masih tetap disokong kuat.
- Terdapat satu cucian (19 Sep) dan satu percubaan (24 Sep) sebelum harga mula mendaki naik.
Berdasarkan pemerhatian diatas, saya akan trade saham ini. Walaubagaimanapun, perlu diingatkan bahawa setiap trading adalah 50-50 dan perlunya ada Trading Plan untuk kita ikuti.
Boleh lihat posting saya sebelum ini mengenai HSS Engineering.

Monitor 0185Daily down trend broken, reach at previous demand zone (second touch), if able to create higher high that time can entry trade. Aggressive can building base and ready to double it at next zone,

<TradeVSA> Pullback Pattern in HSSStrength in the chart:
1. Daily and hourly with bullish signal
2. Pullback pattern in hourly chart
3. High volume Line Change
Disclaimer
This information only serves as reference information and does not constitute a buy or sell call. Conduct your own research and assessment before deciding to buy or sell any stock

<TradeVSA> HSS try to test Resistance againStrength in the chart:
1. Increasing volume and green pentagon in 30 minute chart
2. Hold on the support in 30 minute chart
Send us your preference stock to review based on TradeVSA chart by comment at below.
Disclaimer
This information only serves as reference information and does not constitute a buy or sell call. Conduct your own research and assessment before deciding to buy or sell any stock

HSS in the cross-road (HSS Engineers; 0185.kl)Observation (14/4):
HSS Engineers is one of the construction Companies that is involved in the newly revised ECRL project, overseeing the Designing & Engineering aspect. The stock has been on an Uptrend since early of this year. Based on analysis at the following Pointer:
A) Price was moving within a Trading Range with very low vol.
B) Price enters Mark-Up stage (S2) and move within the Uptrend range. We can see as of 12/4, price did a pullback with the closing within the Uptrend range.
Conclusion:
At present, price is facing strong resistance at RM1.29. It did a pullback on 12/4. There are three (3) possible scenario for this stock:
a) In order for price to move up further, it needs to have either a strong SOS (i.e. Spring or Line Change) with high vol.
b) Price may trade within RM1.15 - RM1.29 (taking a short rest) before moving up. During this time, vol. is crucial.
c) If price break below Trading Range level at RM1.15 with high vol., we consider there is no interest to push price further, hence beginning of Mark-Down phase (S4).
Read my earlier comment on HSS Engineers by clicking on the link below (Bahasa Malaysia version).

HSS - Succesful Breakout?Strength in the chart:
1. Accumulation after high volume
2. Break above resistance but low volume
Disclaimer
This information only serves as reference information and does not constitute a buy or sell call. Conduct your own research and assessment before deciding to buy or sell any stock

Who have the best setup? FGV, Hevea & HSS3 Stock Review based on Volume Spread Analysis.
Send us your preference stock to review based on TradeVSA chart by comment at below.
Disclaimer
This information only serves as reference information and does not constitute a buy or sell call. Conduct your own research and assessment before deciding to buy or sell any stock

