A Breakout Pattern!The candlestick indicates a price breakout above the " triangle" pattern neckline on 2 Oct 2022 backend with volumes. Thus, closed above the SMA line where the stock has consolidated and formed a "return move".
The MACD indicates a divergent pattern where confirming the initial significant price movement toward the next price resistance.
The RSI indicates a bullish reading backed by a positive signals in the trend.
Let's save HUAYANG in WL and watch out significant price movement toward the next price resistant backed by volumes.
R 0.195
S 0.160
HUAYANG trade ideas

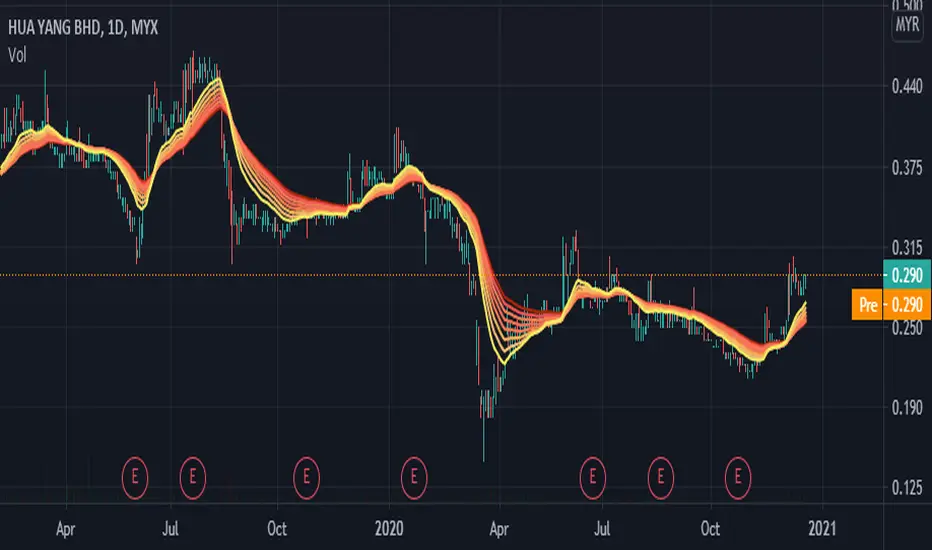
Trend Anaysis HuayangThe trend is your friend. The rainbow average is your guidance angel. If the price is trading above the rainbow, it is a rising angel. Buy and sell at your own risk as the market can change at anytime without any warming. www.klsescreener.com
<TradeVSA> Hua Yang - Sideways with Low VolumeStrength in the chart:
1. Accumulation stage
2. Line Change high volume
Hit the "LIKE" button to support us :)
Disclaimer
This information only serves as reference information and does not constitute a buy or sell call. Conduct your own research and assessment before deciding to buy or sell any stock

Huayang 5062 - Sideway Trading & Potential Triple BottomSideway Trading Opportunity
First TP: 45cent
CL: < 34cent
Patience is needed for sideway trading
OR you can keep in watchlist and revisit after it breaks 0.45 sideway R

<TradeVSA> Hua Yang - Volume Increasing from SupportStrength in the chart:
1. Changes in trend with volume
2. Forming support with Spring
3. To retest resistance soon
Send us your preference stock to review based on TradeVSA chart by comment at below.
Disclaimer
This information only serves as reference information and does not constitute a buy or sell call. Conduct your own research and assessment before deciding to buy or sell any stock
