HUPSENG will it create a leading Diagonal wave or ENDING?Looking at the chart for Hup Seng Industries Berhad, here's my analysis:
Current Price Action:
- Trading at RM0.780, up 1.96%
- Currently in an uptrend channel
- Price holding above key moving averages
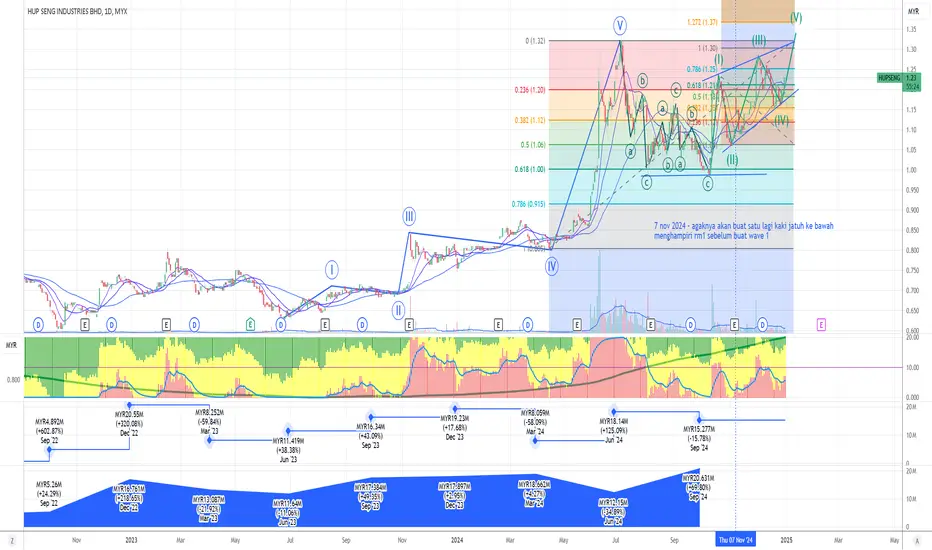
Elliott Wave Analysis:
- Currently appears to be in Wave (IV) of a larger structure
- Previous waves (I), (II), and (III) clearly visible
- Potential for Wave (V) targeting RM1.37 (1.272 Fibonacci level)
Key Technical Levels:
1. Support:
- Strong support at RM0.915 (0.786 Fibonacci)
- Channel support around RM1.00
- Moving averages providing dynamic support
2. Resistance:
- RM1.20 (0.236 Fibonacci level)
- RM1.30 (previous high)
- Upper channel resistance around RM1.25
Pattern Analysis:
- Trading within an ascending channel
- Series of higher highs and higher lows
- ABC correction pattern visible within Wave (IV)
Volume Profile:
- Recent volume supporting the upward movement
- Money flow indicator showing accumulation
- Green volume bars indicating buying pressure
Notable Events:
- September 2024: MYR15.27M (-15.78%)
- Consistent recovery pattern since June 2023
p/s take profit first +-rm3180@27.46%
HUPSENG trade ideas
HUPSENGOur algorithm has identified potential upward signals in the current market. Increased trading volume and prices above the EMA20 and EMA50 suggest a possible upward trend.
💡Trading idea dan plan:
✅Entry: 1.25
🛑Stop Loss @SL: 1.05
🎯Target Price @TP1: 1.45
🎯Target Price @TP2: 1.60
🎉Target Price @TP3: 1.80
(This trading plan is for reference only and may vary based on your entry point and risk tolerance.)
Remember, trading strategies are just 10-20% of your overall success. The real key lies in effective risk management. Having a solid trading plan and proper position sizing are crucial for maintaining the right trading psychology. Master your risk management and stick to your plan.
Happy trading!

Simple13 Trading IdeaTechnical Setup:
The stock took 67 days to break out of the consolidation zone between RM 0.96 and RM 1.16 with high volume, indicating potential bullish momentum.
After the breakout, there is a high probability of a pullback, which creates an opportunity to enter at lower levels within the buy zone.
Entry Strategy:
Plan to accumulate shares during the pullback between RM 1.10 and RM 1.15, a zone that offers a favorable entry based on support and risk management levels.
Profit Taking:
If the price rises to RM 1.30, take profit as this represents an 8.3% upside from the current price, and it is a likely resistance level.
Profit-taking strategies should always consider individual preferences and risk tolerance.
Risk Management:
If the price drops below RM 1.05 and breaches the 20 EMA, cut losses to minimize downside risk, as this could indicate a deeper pullback than anticipated.
Disclaimer:
This analysis is for informational purposes only and should not be considered financial advice. Always conduct your own research or consult a professional before making any trading decisions, as market conditions can change rapidly.
MYX:HUPSENG

HUP SENG INDUSTRIES BHD - [HUPSENG]Bollinger Bands :
Bands: The chart displays Bollinger Bands, which consist of a middle band (likely a simple moving average) and an upper and lower band.
Current Price: The price is currently near the upper band, which suggests the stock might be overbought. This could indicate potential resistance and a possible pullback if the price doesn't break through this level.
Price Action :
Trend: The recent price action shows a recovery from a previous downtrend that started in early August. The strong upward movement with higher highs and higher lows suggests a bullish reversal.
Candlesticks: Recent green candles with larger bodies indicate strong buying interest. The increase in volume during these upward moves further confirms this bullish sentiment.
Volume :
The volume has picked up significantly during the recent uptrend, which is a positive sign as it confirms the strength of the move.
Key Support and Resistance Levels :
Resistance: The immediate resistance level is around the 1.18 - 1.20 MYR zone, where the price recently peaked.
Support: Immediate support is likely around the 1.05 - 1.10 MYR zone, close to the 50-day moving average.
Overall Sentiment :
The stock appears to be in a short-term uptrend, with potential resistance ahead. The movement above the 50-day moving average, along with increased volume, suggests continued strength, but the proximity to the upper Bollinger Band warns of potential short-term pullback or consolidation.
Strategy :
Bullish: If the stock can break above the resistance level at 1.18 MYR with strong volume, it could signal a continuation of the uptrend.
Cautious: Traders might want to watch for a pullback towards the support area around 1.05 - 1.10 MYR for potential buying opportunities.

HUPSENG: Uptrend based on AlgoSignal StrategyThe current point exhibits promising upward signals according to my algorithmic system, meeting various criteria. These include rising trading volume, an upward trend indicated by prices above EMA20 and EMA50, and the closing price surpassing VWAP. As a result, the present conditions suggest a potential upward trend.

HUPSENG undervalued, potential for future growthThe current price exhibits promising upward signals according to my algorithmic system, meeting various criteria. These include rising trading volume, an upward trend indicated by prices above EMA20 and EMA50, and the closing price surpassing VWAP. As a result, the present conditions suggest a potential upward trend.

Hup Seng look for 0.96Buy limit will be around 0.91-0.92 based on price is below 200 ema on weekly chart.
From there I will go long to 0.96 & it looks that the price will be test. If the price break it will potentially go to around RM 1.005 in extension.
If it doesn't, it may retest RM 0.945.
TAYOR


MYX DY Stock #1 - HUPSENGDY Stock #1 - HUPSENG
Fundamental Analysis
Dividend is consistent for past 10 years. DPS = 6 CPY (Cents Per Year) over the past 5 years.
Company has strong fundamental with good liability ratio (~30%) .
Revenue and profit is growing every year.
Business sector is involved in the food and beverage industry.
Technical Analysis
7 years impulsive waves.
3 years correction ABCDE with (3,3,3,3,3) waves was high probably done.
DY is around 6.2% in the range of 0.90-0.98 entry zone.
Therefore, this stock has a good entry as dividend gain stock.
Entry
Entry 1 : 0.875 - 0.980 (To target DY > 6%)
Average Down as long as company fundamental is not affected.
Cut Loss : 0.860
Exits
TP1 : DY = 2% - 3.00
TP2 : DY = 1.5% - 4.00
When DY is less than Fixed Deposit in MYX
DYOR before investing your hard earn money!

HUPSENG singgah di paras 0.5 Fibonacci- HUPSENG berada di fasa konsolidasi sejak Ogos 2020.
- Pecah consolidation area pada 5 Nov dan membuat kenaikan terus sehingga paras 0.975.
- Melakukan pullback dan bertahan di paras 0.5 (harga 0.95) di Fibonacci retracement.
- Boleh masuk watchlist.
Ini bukan buy call.

