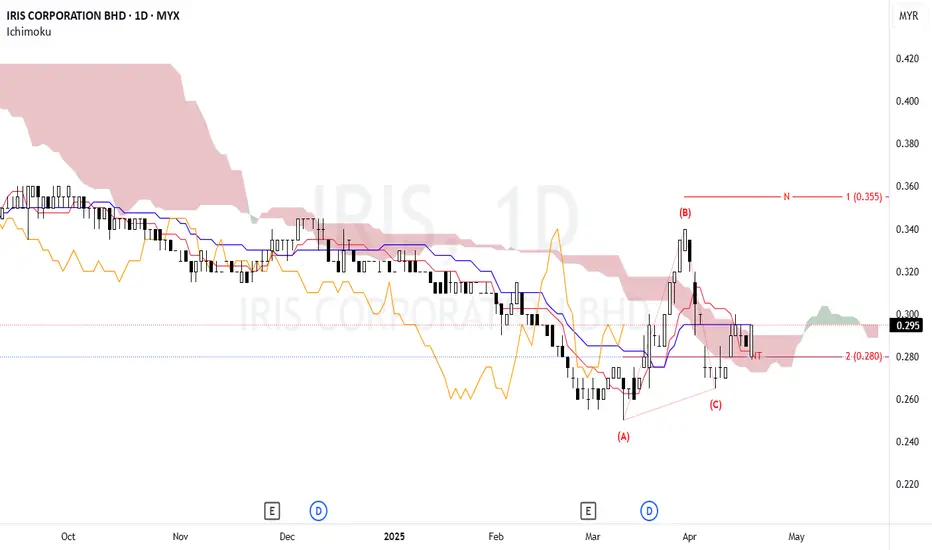
IRIS - Looking for bullish momentumN wave with N & NT projection.
NT as immediate support.
Price to maintained above NT level for bullish continuation.
Price is testing the bottom edge of the Kumo, suggesting a possible breakout.
Thin cloud ahead indicates less resistance—bullish potential.
Tenkan-Sen crossing above Kijun-Sen confirming bullish momentum.
Chikou span has crossed above the price candles and approaching the cloud—neutral to slightly bullish signal.
Bullish Bias, if the price can:
Hold above 0.280 (NT projection / Kijun-sen support).
Break and close above 0.300 (cloud resistance).
Stop-loss: Below 0.280 (under NT level and Kijun-sen).
Note:
1. Analysis for education purposes only.
2. Trade at your own risk.
IRIS trade ideas
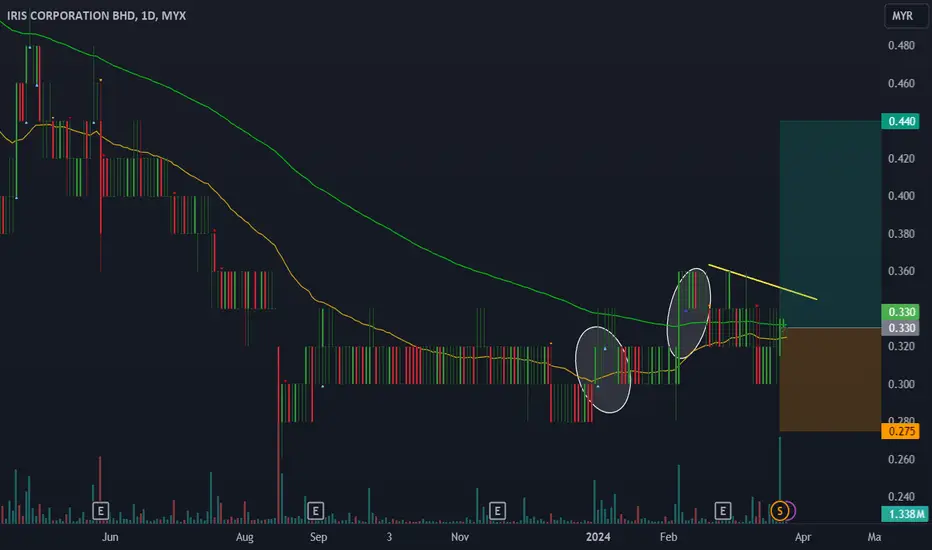
IRIS, Direction sidewayThe market direction remains in a sideways trend, but there's potential for a rebound as prices have hit a lower limit around 0.0.28, indicating accumulation by buyers at this level.
This accumulation is signaled by the algorithm, with the appearance of blue signals occurring multiple times before during rebounds above the support level.
Can Iris make-it?On Fri 24 Feb Iris had reported its Qr and the result was considerably good. The market reacted to the result by pushing the share price which was struggling to even hold at 0.110 at that time to close at 0.120.
On the chart wise,
1) the volume is still low (below 14 ma) indicates Sellers are weakening and Buyer's low appetite.
2) the stochastic is in oversold territory which indicate the risk reward to the downside is smaller compare to the upside.
3) the RSI is showing divergence to the price action (white line) which may indicate that a reversal to take place.
If the QR result can bring the confidance back to investors, a reversal may really take place.
On the upside, it may fill the gap at 0.135 and the next resistant is at 0.165 followed by 0.195.
To the downside, if it cannot hold the RSI trending line (white line) and break down 0.105 price action, it may reach to 0.09 support followed by 0.08 and 0.06.
Disclaimer:
This is not a Buy / Sell call. This material is for learning purposes only.
Consult your financial advisor and trade at your own risk.


Can Iris Climb Out Wall of Misery?Iris Corp is the awarded company with a Rm 1.1b Niise project after SKIN project had been terminated. Only that, recently there is an investigation on the appropriateness conduct during the award process.
The share price had tanked since the announcement it won Niise project until today. Currently there is a huge battlefield between Sellers and Buyers at around 0.110 ~ 0.120.
Even so, looking at the RSI it is touching upward moving line while the Stoch is at oversold territory.
On chart pattern wise, it had escaped from a tremendous bearish channel. It also indicate triple bottom and triple top which is left undecided yet.
Whether the RSI will bounce and gain back the momentum after it touch this line is depend on 0.110 critical price point. Break below this point will indicate further weakness and potentially move to 0.090.
On the upside, there is a gap to be fill at 0.135. If it move and fill the gap, next resistant will be 0.165 followed by 0.195.
Disclaimer:
This is not a Buy / Sell call. This material is for learning purposes only.
Trade at your own risk.


IRIS REBOUNDNG AT FIBO786 IN WEEKLYCan try to take a long position on IRIS as spotted rebounding at fibo786 in weekly chart with a volatility change to positive. Probably retracement EP would be at current price and TP at fibo618 in weekly chart. CL when the volatility changes to negative as depicted in the proposed trade plan.

IRIS break downtrendline for reversalIRIS break daily downrendline with RSI bullish divergence. FIBO 0.21 passed.Next test 0.255. if success, will go towards 0.30

Watchlist IRISCan monitor if price BO and closed above trendline (yellow line)
Watchout for volume from Banker Increasing.
#TAYOR MYX:IRIS
#credittoZQAnalysis

Iris in Imminent Falling Triangle BreakoutIris had started forming a Bullish Falling Triangle pattern on somewhere in Mid Jan '21.
Eventhough they had been awarded with goverment project (NIIS) in March, the pattern keep intact.
Recently the triangle band had become narrowed. I anticipate that Iris had done it's final pullback and ready to breakout from the pattern.
Currently:
1) it had reached the 0.205 support line which was created during its uptred pullback (more than 1 yr ago).
2) If we look at its lower low price line (a) and compare with its RSI (a') , we can see that the RSI is pointing up which show that eventhough it is making lower low but it is gaining more strength and hopefully will become a momentum for Iris.
Disclaimer: This is NOT a Buy / Sell call. This analysis is for learning purpose only.


IRIS - Going UpIRIS has started to go bullish.
There is a possibility to complete the pattern.
You can take a long / buy and TP around 0.320-0.325 and a stoploss around 0.265
Risk : Reward of 1:3
Please take care of your money management


IRIS potential to start to reboundWeekly already oversold.
Daily just cross EMA50 with solid volume.
Daily already break short down trendline.
Daily price already backs to the up trendline channel.
Therefore, IRIS have the potential to start to rebound.

IRIS -Double TopTrade ideas for this counter.
Bias more to sell..Need to break 0.45 to further uptrend.

Remains BullishWe noticed a Bullish breakout above DTL1, strengthen our Bullish view on earlier post on Dec 3. However, the price has made a return move on recent week, remain above support marked as S1. Nearest support is at 0.33 and a price movement below S2 at 0.24 will negate this Bullish view.

IRIS - Downtrend Continue ?Starting last week, the trend starting to downtrend.
On 2 Mac already break support 0.360.
Current indicator:
- Stochastic drop to Oversold
- Momentum below 0
- Huge distribution activity
- No Banker Chip In activity
Projection:
- Trend will continue down if break intermediate support 0.315.
- Trend will heavily down if break 0.270.
Trend Reversal:
- If trend bounce up at 0.315 and continue to break 0.360, it is trend reversal indicator (trend up).
#NotBuySellCall
#EducationalPurpose


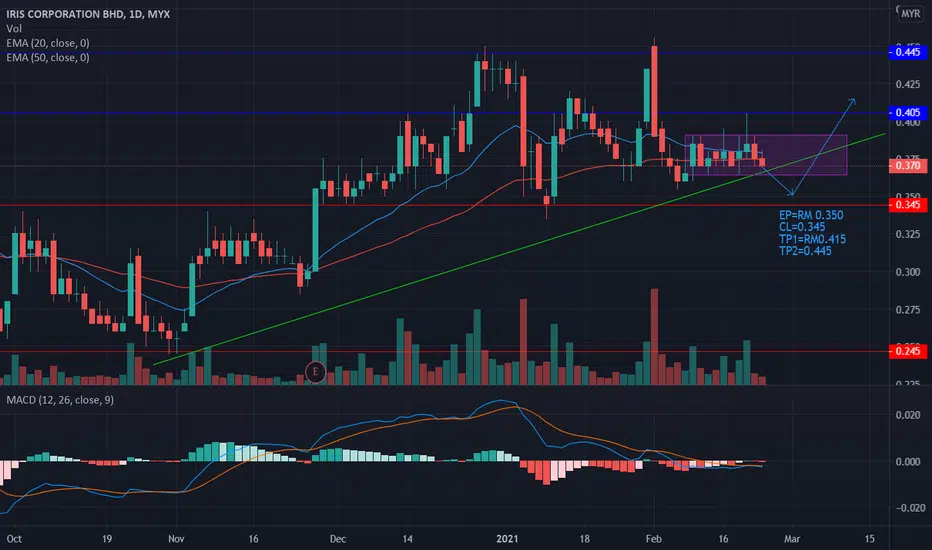
UPTREND COUNTERANALYSIS (24th FEB 2021)-Counter is in the uptrend manner and now in sideway behaviour. im expecting it to retrace a little bit above its support level and enter there or whenever the blue MACD line crosses the red line. u guys can add ideas or additional info. thank you
Bursa IRIS Corporation BerhadTriple TOP has been formed from the ascending/ uptrend trend. Attempt to break the 0.450 with the triple top pattern and soon the price will break that price & moving above 0.40.
Disclaimer: If you choose to follow this trading idea you do so at your own risk after giving thorough and reasonable thought and consideration to your actions. All trading is high risk and one of the most difficult activities you will ever consider. Don’t trade with money you can’t afford to lose.

IRIS BUY OPPORTUNITYChip in buy around RM 0.31 - 0.33 as it is significant support area. Currently, price still in ranging and there's nothing to point out. Just wait for the price action reach to the green zone area.
