WEEKLY JFTech EWPlease consider the mapping as an idea sharing. Strictly trade at your own risk.
#T.A.Y.O.R
JFTECH trade ideas

JFTECH - TA1. Price candle break out MA 200 on 7 June '23 give strong signal the price movement may change direction to bullish soon.
2. Price candle testing MA 200 on 25 Aug '23 to 29 Aug '23 to shake out weak retailers. Price candles break out MA 200 again on 30 Aug '23.
3. GC (Golden Cross) MA 50 & MA 20 happen on 16 June '23 give another strong signal the price is build up the uptrend momentum and ready for bullish.
4. Price candle with MA 200+MA 50+MA 20 in progress to aligned altogether give sign the price is ready for bullish.
5. Price candle has BO strong resistance (0.935) on 11 Sept '23 and PB may take place to setup a support area and GC. Price candle that BO the last red candle at this support area will be the 2nd EP.
6. EW analysis includes in this TA together with sub wave count. Currently price movement in sub-wave 3 of main wave 3. Sub-wave 3 target profit at 1.49.

JFTECH TF DailyJFTECH Time Frame Daily
Hai Traders
This chart nice to review
Already breakout down trendline
When break 1.20 this RBS possible whan to giong to higher
#thisonlyforpredectionstudy
#thisnotforbuycallorbuysell
#chartpattern
#TAYOR
#MFM.TRADER

Fibonacci techniquePrice react to 0.5 level
Recently break 200 EMA and probably a good support level

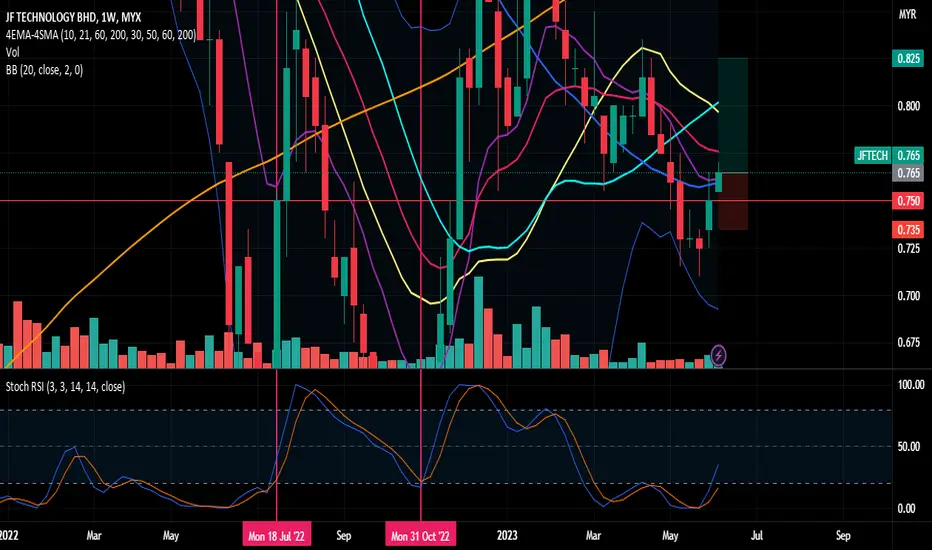
JFTECH Shows a Sign of Rebound From OversoldBased on weekly chart, the price start to moves up from the oversold region as well as from MA50. Not only that, the price breakout today (6 June 2023) with a large volume. It will be good if the price can breakout from MA20 and forming a higher low (on weekly chart).
breakout!Idea made based on the combination of support resistance, gann chart, fibo and pva
fibo tp 1 @ 1.04
tp 2 @ 1.32
this is just an idea not a buy call. feel free to do your own technical analysis / fundamental analysis before entry :)
TAYOR

JFTECH 7422JFTECH dalam range sideway selepas buat kenaikan
boleh perhatikan
ada tanda2 akan baut lagi kenaikan
market strucutre masih dalam uptren HH HL
boleh cari entry yang tepat.

<TradeVSA> Inverse Pullback with Weak Trend - MI | INARI | JFTECSign of Weakness in the chart:
1. Red Pentagon below 20/40ma
2. Upbar low volume
3. UT and ND near 20ma
4. Negative Pentagon Flow
Disclaimer
This information only serves as reference information and does not constitute a buy or sell call. Conduct your own research and assessment before deciding to buy or sell any stock

JFTECH IN BULLISH ABCD HARMONIC PATTERNRelevant fibo levels in the pattern are as per chart.
This pattern is identical to Gartley Bullish Harmonic Pattern. The price has demonstrated a rebound at EMA200 and around fibo786 level.
Probable EP would be 1.405 to retest the 4h pivot point and fibo786.
Probable TPs would be 1.490 (ie daily pivot point), 1.550 (that is fibo236 and slightly lower than point C) and 1.670 (ie yearly resistance).
The probable CL would be 1.320 (ie below monthly support 1.325)

JFTECHVCP setup and price stand above MA 60 with buy signal
Mcdx strong banker above 50% with 0% of retailer
Plan :- Monitor it. Valid only if price stay above MA60.

JFTECH VCP SETUP Follow UpPreviously mentioned JFTECH VCP setup in July. Unfortunately, it decide to go another contraction and seem like we have a tight once again.
The entire VCP setup shown in Weekly chart as below:
C1: -42%
C2: -20%
C3: -12%
C4: -6%
Let's monitor if this round successfully breakout with volume follow through or not.
Disclaimer:
Not a buy call recommendation. Just a my personal opinion in technical analysis through chart pattern and technical indicator. Trade at your own risk.

JFTECH TECHNICAL ANALYSISTechnical analysis for JFTECH Stock based on Trend Analysis, Chart Pattern and Fibonacci Retracement

JFTECH PATTERNEach time the rise after BO of the triangle it show the same height.
CL if break below major trendline.
#TAYOR MYX:JFTECH


Tech stock boom end soon or just starting ?Doest matter as long as you follow ur trading plan (except if you are investing )

Jftech rebound trendlineThe stock showing rebound from its trendline support with significant price
Opportunity when break resistance 1.58

JFTECH : VCPCould be VCP Pattern
Disclaimer
Any information contained in this page should be considered as general information, research and learning only. I am not responsible for any actions and decisions made based on the information from this page. Thank you
#TAYOR
Jftech sun shine hahalike my previous post, Jftect still Healty. still above Trendline Support (Maroon). a bit slow as it was in wave 1-2 Eliot Wave.
till now it making correction. may starting "hike higher" when Nasdaq break ATH as tech sentiment to bullish.
my TP1 still RM1.8
and TP2 RM2
HODL on my JFterian hahah
To Be consider, this is just sharing idea. any risk is all depend on your Trading Plan.
T.A.Y.O.R
#TP Dua ringgekkkk :p


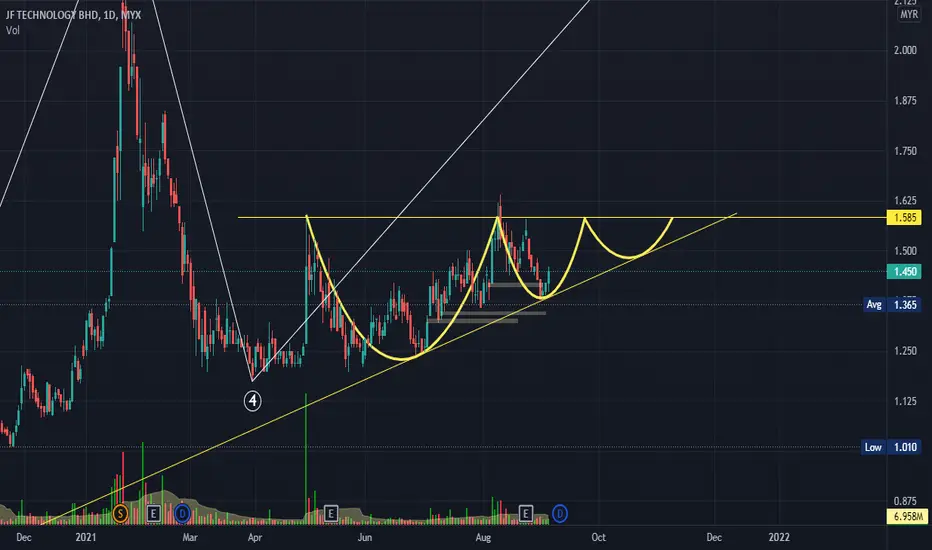
jftect wave 3?if cup and handle, looks like can TP RM2 haha
first hit Fibo Extend RM1.7++, second TP RM2.
HODL Jfterian ! haha

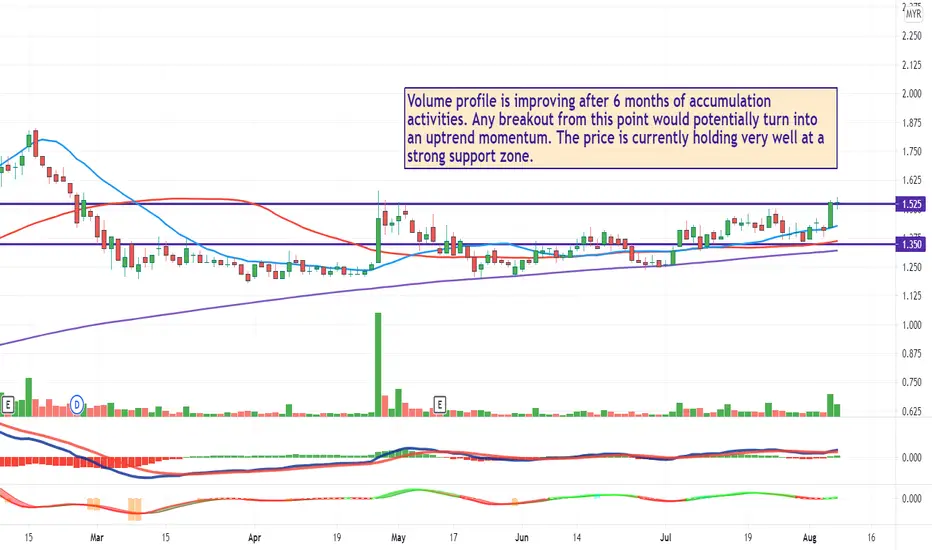
Jftech (KLSE 0146)Volume profile is improving after 6 months of accumulation activities. Any breakout from this point would potentially turn into an uptrend momentum. The price is currently holding very well at a strong support zone.
JFTECH created Cup and HandleConsidered a bullish signal extending an uptrend, and is used to spot opportunities to go long.
Disclaimer
Any information contained in this page should be considered as general information, research and learning only. I am not responsible for any actions and decisions made based on the information from this page. Thank you
#TAYOR
