JFTECH VCP SETUPJFTECH 169 days VCP development with below contraction:
C1: -44%
C2: -21%
C3: -11%
C4: -7%
Bursa Tech sector showing rebound signal recently and Nasdaq movement is strong as well.
Fundamental wise, JFTECH prospects looks good in their 5G & AUTOMOTIVE testing application.
Waiting for breakout.
JFTECH weekly chart also showing nice setup!
Disclaimer:
This sharing is based on my personal technical analysis experience and i am not giving any buy call recommendation. Kindly refer back to personal stock remiser on the recommendation. Trade with your own risk.
JFTECH trade ideas


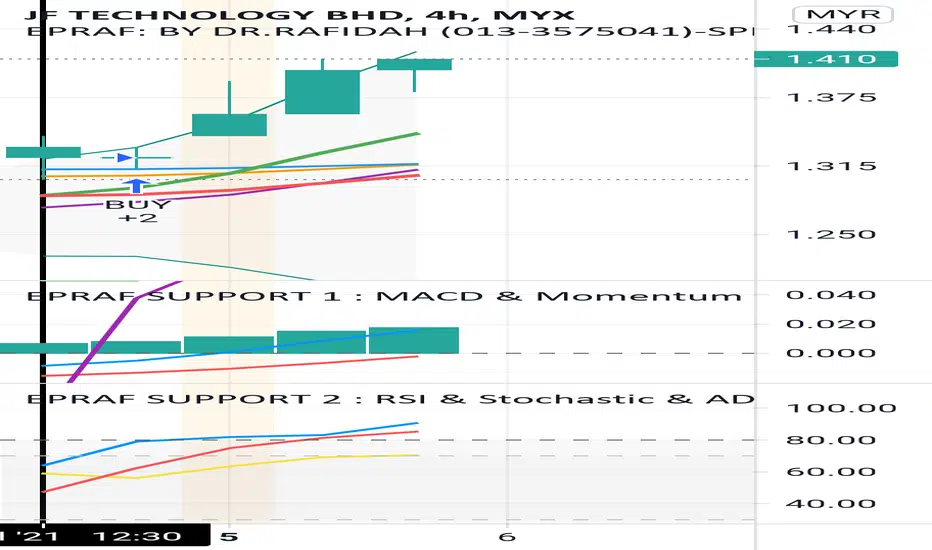
JFTECH is expected to fly??? See EPRAF indicator, JFTECH started its uptrend phase on July 2, 2021 when the green line crossed the red line. With a good MACD and RSI, JFTECH is expected to fly.
Trading Plan using Harmonic Pattern and Fibonacci on 3/7/211. Weekly TF show major uptrend (yellow line)
2. For Harmonic found Deep Crab pattern and point B exceeded 88.6%
3. My Trading Plan if break for point B is my EP and CL at point A
4. Using Fibonacci retracement point X-A to get point D at 161.8% for my 1st target.
#swing
#TrailingStopLimit MYX:JFTECH

JFTECH ALSO A NEW BEGINNINGTHIS IS MY SECOND IDEA.
WHY I REVIEW THIS STOCK? BECAUSE I WAS LONG TERM INVESTOR ALREADY IN THIS STOCK.
AFTER BEING INVESTOR FOR A WHILE, NOW I CAN SEE ALL THE MISTAKES I MADE FOR THIS COUNTER.
THIS ALSO A NEW START. WELCOME TOGETHER TO BE A NEW TRADER. THIS STOCK GOOD FOR TRADING


Fundamentally good, technically...JFTECH released good result for 3rd quarter report on 11-05-2021.
Red Hidden line is drawn as the gradient for Flat Bottom at 1.32. It needs to break the gradient and stay above 1.32. in order to surge up.
NASDAQ and KLCI tech sector is retraced, so undeniably it unable to perform, but this stock always skyrocketing when there's lesser and lesser volume traded.
Resistance around 1.45, let us see how it goes.

JFTECH - Long consolidation awaiting for Market Mover Trading Strategy:
1) Follow entry zone
2) Ride till specified TP based on your appetite
3) CL is there - its up to u..to use or not..hehe
My suggestion to hold and invest in this stock with forecast future business insight..
I am nubis, i am non-premium members ..follow if you think this idea make sense..just sit back, relax and make some money.
-Heil_Z-
# Are-snuff Traders Club
# Bilis Traders Group


<TradeVSA> Hidden Sign of Strength in JFTECHSign of Strength in the chart:
1. Price hit support with Sign of Strength in weekly chart
2. Green Pentagon and Line Change in Daily Chart
3. Potential Pullback in Hourly chart with Sign of Strength
Disclaimer
This information only serves as reference information and does not constitute a buy or sell call. Conduct your own research and assessment before deciding to buy or sell any stock

JFTECH Daily TimeframeAfter completed pattern as per previous post dated 7 March 2021, following with sideway... it's time to go up.... find your own entry based on your trading plan...


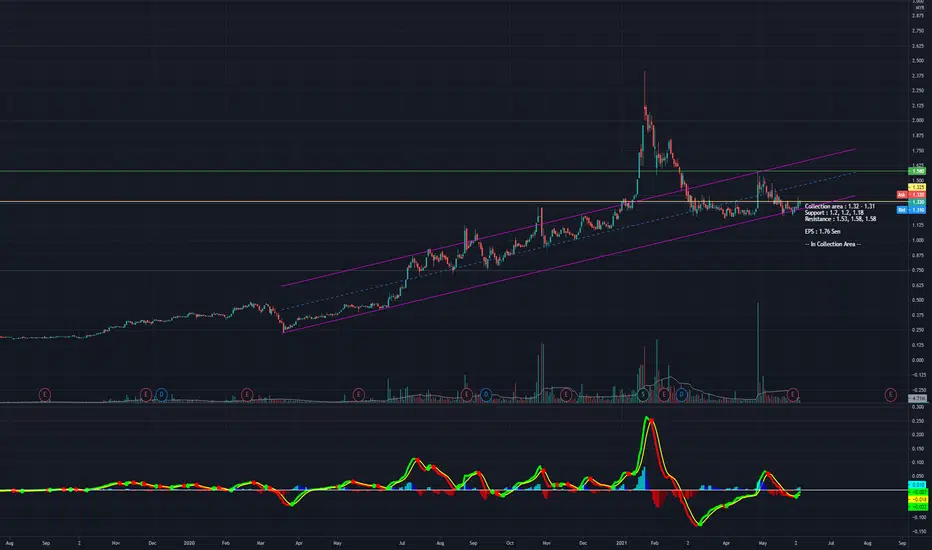
Consolidation at the worth continuationJFTECH as seen one of the rising stock in the semiconductor. Previous year and early of the year in 2021 has shown the stock price significantly emerging due to the demand on the chips and semiconductor.
Most of the tech stock, has higher PE. This PE can be reflect the market expectation in the laymen term which is terribly high, making it as the high risk in the stock valuation.
Ahead of the prospect of JFTECH, as the time of writing; share price has been pulling back since the peak price met and found the low price for the consolidation. Reflecting to the earning, this company has the strong cash and should continue to rise in the EPS. The higher the EPS(Earning per Share) the higher chance of trade above the average price.
Safe zone for entry : RM1.30
TP1 : RM1.38
TP2 : RM1.45
TP3 : RM1.60
TAYOR.
#MisiDuitRaya2021


JFTECH Daily TimeframeClassical Pattern still on the move of going south?
Reversal fighting between Bull and Bear in the Circle has been dominated by Seller thus another confirmation of strong Down Trend or simplified as SBR
Still waiting for the area of interest around RM1.00++

JFTECH-Is pullback completed?Been pullback for few days. With the volume building up, looks like the pullback is completed. But I shall wait next day's volume to confirm on that.

JFTECH BHD - KLCI ( Possible retests level )Managed to hold 0.618 and a short term crucial zone.. 4 possible movements that will follow by it's up coming possible achievements..

JFTECH Target LongOverall this counter is bullish trend and now price under retracement phase. If refer to lower TF H1 & H4 we can see price under compression (candle become smaller) . To be safe wait price breakout TL and retest before enter market. Can look for buying opportunities if price reject at support area either reversal candle , double bottom pattern or compression . SL if break support area and TP at nearest resistant to be safe.

JFTECH - No Hope YetJFTECH
Theme: Tech
Rst: 1.69
Spp: 1.48
As the stock continued to face resistance at Fibo Ext 50%, there’s still further space to retrace towards its multiple supporting point at 1.48 (MA50 + Fibo Ext first tier), nothing enticing now to ride this. Any chance of rebound will be shortlived since downward trendline has emerged.

waiting breakout on pennant patterngood entry for a good company
-MFI index is still overvalue (good)
please do your own research

JFTECH POWERPLAY SETUPPowerplay setup.
Rise >100% in 30 days.
Contraction ~30% in 21 days.
11 Feb 2021 price stand back above EMA10. Attack soon?
QR for JFTECH has released. Looks good. Related to 5G and Automotive!
Disclaimer:
The content provided is my personal experience sharing through technical and fundamental analysis point of view. The content can only be used for education purposes and NOT any recommendation for buying or selling stock. Please ask your remiser/dealer for making decision. Trade at Your Own Risk.
