K1 - Stock to watch (potential uptrend)This stock has break the Ascending triangle and i have miss opportunity to buy at the pullback price(0.165). Technically it has break ma200 where it is now showing an uptrend movement.
K1 trade ideas

K1 triggered based on MRV1 on closing 18 Dec 23Buy signal triggered based on MRV1 setup at RM0.155;
20% target at RM0.190; stop loss at RM0.135;
2-3 months due to the signal based on the daily timeframe.
**Only for discussion purposes. Not a buy / sell call**

K1, Ready For Take OffTechnical View on K1
- Trend : Uptrend on W1, retrace on D1
- Zone : Below Mid BB W1, hit Lower BB D1 also aligned with SnR
- Chart : Descending Triangle, Bullish Divergence
- Signal : Candlestick Compression Signal appear
- Volume : Break MA 10 days Volume
- Multi TF : D1 and W1
- RR : R3

K1 - Pre Consolidation BreakoutNO INVESTMENT ADVICE IS PROVIDED EXCEPT FOR TECHNICAL ANALYSIS PURPOSE.
DISCLAIMER
Please consider your own interpretation of Opportunity & Risk. The author of this post strictly follows the Malaysian Security Commission ( SC ) Guidelines on the prohibition of Investment Advice by unlicensed parties. Any examples shall use historical charts without any recommendations and not to cause inducement to the public to take action or position (e.g. buy, sell or hold) regarding a particular class, sector, or instrument in relation to securities or derivatives. The author will never provide any investment or trading advice as the activity of giving investment advice is likely to be considered as a regulated activity under the Capital Markets and Services Act 2007 ( CMSA ). All posts made in Tradingview do not include any communications involving providing recommendations or opinions or includes any material, content or any statement which are likely to induce a person to take any action or position (e.g. buy, sell or hold) regarding a particular class, sector, or instrument in relation to securities or derivatives that is likely to be considered as “advising others concerning securities or derivatives”. The author will not recklessly make any statement, promise or forecast that is misleading, false or deceptive to induce or attempt to induce another person to deal in securities or derivatives. None of information posted in post can be used as investment decisions. Do not trade solely on the information posted. Trade at your own risk and judgement. A trader could potentially lose all money. Only risk capital that can be lost without jeopardizing ones financial security of lifestyle. Please seek licensed professional guidance if you plan to invest your capital seriously.


END OF DOWNTREND?Failing of making a new lower high and lower low may be indicates us that K1 will be starting a new trend. huge volume suddenly came in, ma20 and ma50 almost cross. worth to watch


K1 hourly chart on 30/11/20 shows momentum of banker chips.Chart moves side way since September 2020. Hourly chart on 30/11/20 shows momentum of banker chips. Good sign?


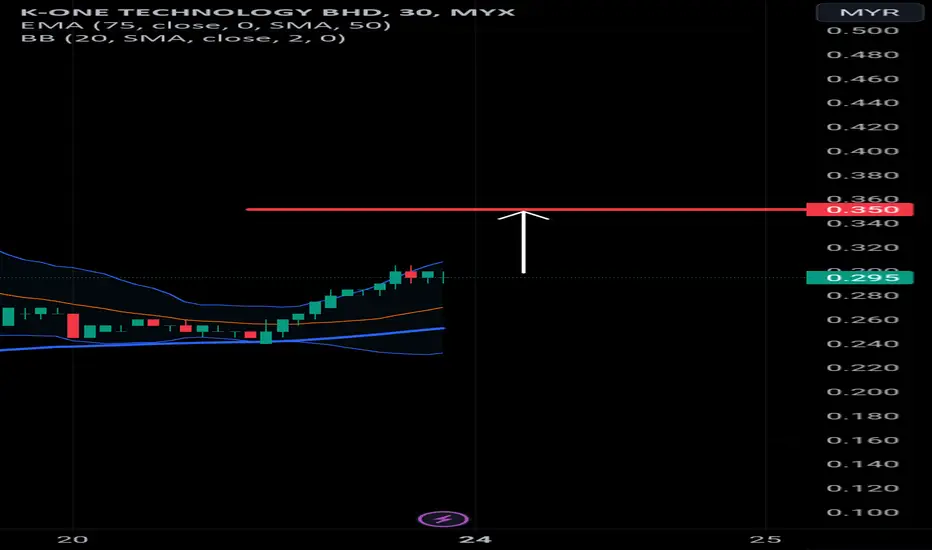
K1 WILL REBOUND IF PRICE MAINTAIN ABOVE RM0.35K1 WILL REBOUND IF PRICE MAINTAIN ABOVE RM0.35 ON MONDAY 14.9.2020


BULLISH ABCD & SUPPORT LINEBerdasarkan pattern ABCD menunjukkan harga boleh menuju kebawah. Tapi line support weekly digunakan adalah sangat kuat dan sukar untuk dipecahkan.
Jikalau harga menuju kebawah, boleh consider buy kat fibo line biru dan take profit berdasarkan line fibo hijau kat atas..
Tayor...


K1: SLOW AND STEADY?I don't understand with the movement of this stock because originally k1 was a technology stock. Then it embarks on PPE and Mask. Now, this stock does not have its own identity, I think because it likes to follow the move of healthcare stock instead of technology. But its movement was really slow and wired. It friend HLT already passed RM1, but k1 still move nowhere. However, based on technical, I think it will move as my chart pattern prediction.
PS: This is my personal view, trade at your own risk.


Training 6/8/2020 - K1Any input @ feedback for me to improves in drawing the chart and writing down my trading plan is really appreciated. Btw, be nice please.. Thank you and have a great trading
