KARYON (Double Bottom Breakout)Volume Spike + Double Bottom Breakout
Possible searching for intraday pullback entry opportunity around 0.195.
Disclaimer:
For discussion and sharing purpose only. NOT entry recommendation. Trade at your own risk.
#TAYOR
KARYON trade ideas

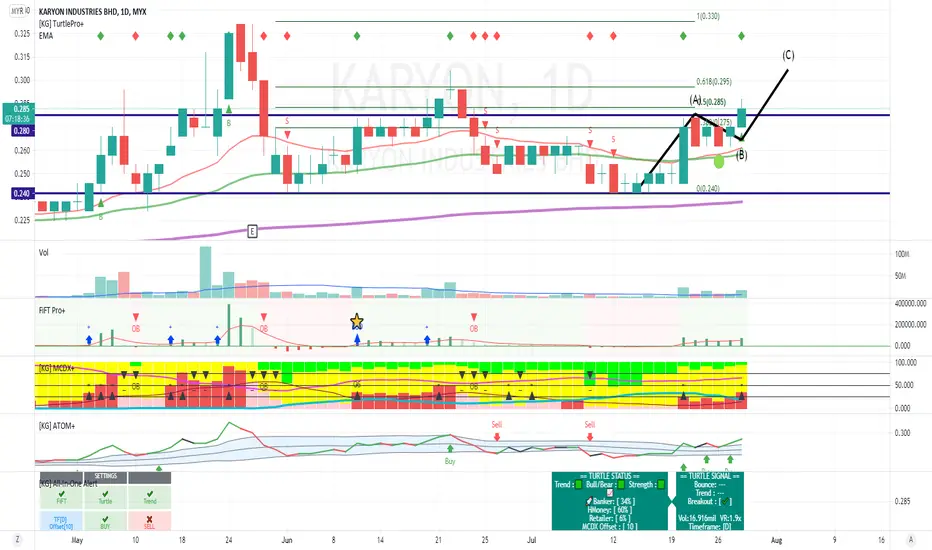
KARYON (10/09/2021)*Study Counter*
CI - Market going towards trending
WM - Whale increasing
MM - Peak and heading to oversold
Pattern = uptrend channel , complete falling wedge,
Bearish Butterfly Pattern -
target TP at 0.315 before retrace to minimum of 0.290.

Extremely attractive counter- KARYONGood fundamental.
Directors buying stake in own company.
Uptrend momentum intact.
Recently breakout from RM0.30 and hold strong above RM0.30 which now serve as strong support.
Proper shake out and churning done last friday and.
Strong buying force at RM0.305 evidenced by 77,000 lots volume done on Friday.
Watch closely for breakout from RM0.315

KARYON DOUBLE BOTTOMPrice still intact in symmetrical triangle line. Monitor if price BO which line above or top to determine next trend.
#TAYOR MYX:KARYON


KARYON. MID + LONG CUP AND HANDLE ? DISCLAIMER : FOR RESEARCH AND STUDY PURPOSE ONLY.
KARYON INDUSTIRES BERHAD (KIB)
SECT : INDUSTRIAL PRODUCT AND SERVICES
SUB SECT: CHEMICALS
PLASTIC R/T STOCK.
8/9/2021
price : rm 0.295
m.cap : 140.34m
no of share : 475.71m
eps : 1.62
p/e R : 18.21
roe : 7.36%
nta : 0.220
div yield : 3.39%
cash & bank balance = rm41.72m to 33.66m
inventories = rm25.12m to 23.20m
borrowing = rm7.92m to rm8.37m . gearing ratio 0.08 x .
CANSLIM
C : Q121 VS Q122 = INCREASING 102%. Q122 BEATS ALL Q IN 21 IN REV AND N.PROFIT. PROFIT MARGIN LATEST Q122 VS Q421 = +77.7%
A : 2019 = 4.4M . 2020 = 6.8M . 2021 = 4.7M . 2022(Q1) = 3M.. REV DECREASE OF 11.02% COMPARED TO PREVIOUS ANNUAL REPORT DUE TO, MCO ON 18/03/20.
N : no new product.
S : SMALL CAP. RINGAN
L : LAGGARD. PEERS = PCHEM, BKAWAN, LUXCHEM, SAB, ANCOM, ASIAPLY, NYLEX, ANALABS, ARTHRONIQ, SCNWOLF
I : OCBC SECURITIES PTE LTD.
M : FORMING C&H IN AUGUST 2020- SEPT 2021. WITH A LARGE PERIOD ALSO C&H SINCE APRIL 2017-SEPT2021
S= 0.295
S2= 0.280 . S TO S2 = -4.85%
R =0.305 . S TO R = 3.2%
R2 = 0.33 . S TO R2 = 11.7%

KARYON1. In terms of the fundamental company quite nice because it a big player in PVC compounder in Malaysia
2. The shareholder changing between insider
3. In terms of TA, the trend is uptrend base on the chart
It is possible it will go higher? will see..

KARYON : +ve QRReaction market after +ve qr?
waiting to break the trtiangle
Resistance (R) : 0.28
WEAK Support (S) : 0.25
VERY WEAK Entry Price (EP) : 0.280 With strong buy of 5 Market Depth (5MD)
Target Price (TP) : 0.32
Stop Loss (SL) : 0.265


Karyon Potential N pattern Breakout tradeMYX:KARYON
Slow Turtle Buy
Uptrend
FiFT +ve
MCDX+ Spike up
Banker 34%
Atom Above River
Turtle Status Green
KARYON - starts to climb???Refer to the EPRAF indicator, last Friday the green line crosses the red line. This indicates that KARYON has just stated a new uptrend phase. So maybe KARYON will start climbing tomorrow.

<TradeVSA> Pullback from Re-accumulation - KARYONSign of Strength in the chart:
1. Long period re-accumulation
2. Pullback
3. Shakoeut
4. NS signal at support (weekly chart)
Disclaimer
This information only serves as reference information and does not constitute a buy or sell call. Conduct your own research and assessment before deciding to buy or sell any stock


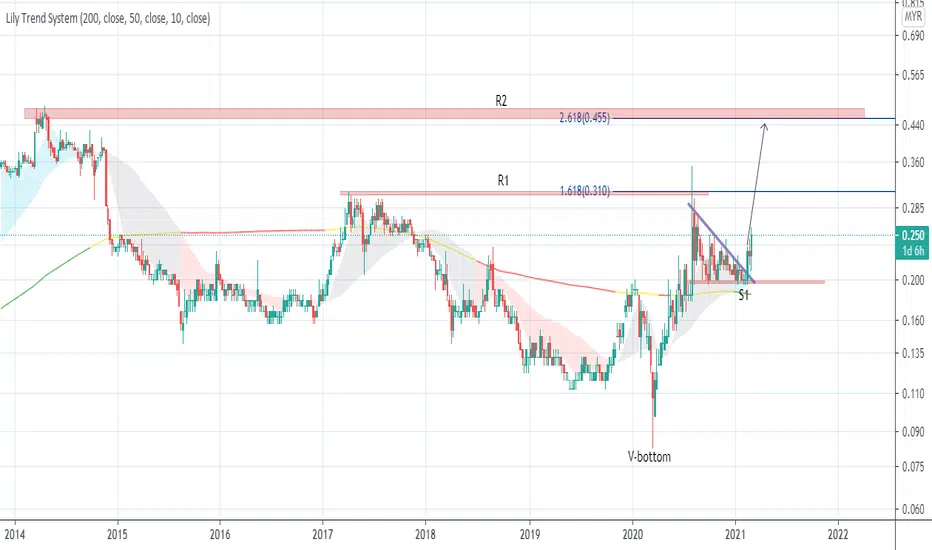
Momentum building upKARYON tested resistance level R1 at 0.31 and recovered the pullback with further movement to the upside above Valid DTL. We suggest the price could rally towards the next resistance level R2 coincide Fibonacci target 2.618. On the flipside price movement below 0.20 may push the price lower.
Disclaimer: The content on this analysis is subject to change at any time without notice, and is provided for the sole purpose of assisting traders to make independent investment decisions.


KARYON still in accumulation phaseOBV is increasing showing an increase in buyer interest.
Price has the potential to go up once breakout above 0.245.

KARYON ready to go upsideLooking at fibo, the price rebound at fibo level 0.618.
Price already break down trendline and crossed daily Ichi cloud.
KARYON have the potential to go upside.

Possible breakout for KARYONKARYON has been traded in sideways since September 2020 and failed to break 0.24.
Since August 2020 directors of this company keep acquire the shares which shows a good sign
Starting from last 18th February, the volume traded in this stock spikes above than normal volume
Current price above EMA20 and EMA50 indicating potential uptrend
Current increasing in PVC future price at DCE (>8000) also may help this company to gain more profit than previous days
Anyhow if fail to break 0.24 and the price below 0.215, this stock will maintain in sideway phase


Karyon, breakout with finger.Once, there is a strategic call Fairy pointing finger pointing. Can it be real?
Follow my FB pg for more info.
