Simple13 Short Term Trading Idea (KOSSAN)Current Price: RM 2.08
Profit Target: RM 2.30
Buy Zone: RM 1.95 - RM 2.08
Entry Strategy:
Start accumulating KOSSAN shares in the buy zone between RM 1.95 and RM 2.08. This range offers a favorable risk-reward ratio.
Profit Taking:
If the price reaches RM 2.30, take profit, as this area is considered a resistance level or the stock may be overbought, and it might be prudent to lock in profits. This translates to a potential upside of 10.6% from the current price.
Risk Management:
If the price drops below RM 1.95, exit the trade to limit losses. This sets the downside risk at approximately 6.3% from the current price.
KOSSAN trade ideas


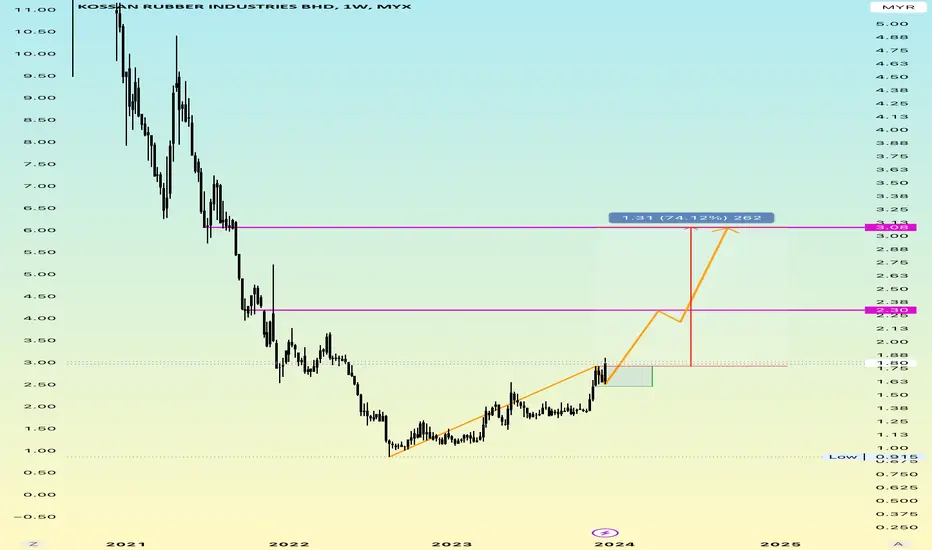
Kossan strong bullish coming KOSSAN TIme Frame Weekly
Hai Traders
Interesting to note
Only suitable for long term
There is a already breakout strong resistance
Just waiting until your TP ☺️
#thisonlyforpredectionstudy
#thisnotforbuycallorbuysell
#chartpattern
#TAYOR
#MFM.TRADER
Kossan. Where is its demand / base / stop? 16 / August/ 22Kossan previous major demand / base / stop was created on 29/ Dec / 2014 weekly bar as shown on chart.

Kossan. Finding its ying/Yang force with channel. 14/July/22.Kossan. Today I gonna “bullsxxxing” a “myth” about ying ( seller force ) , Yang ( buyer force ) AND neutral force ( median line of parallel channel) again “represented” with parallel channel. P/s Since tradingview “free user” don’t have enough data feed. I have to “superimposed image” by using 3rd party apps to have more “history data” for “whole view” of its chart where it is still publishable in tradingview.

Kossan possible breaking ATH of 7.90 But 0.90 first. 19/June/22Disclaimer : All past, present, future chart analysis are for illustration, research, studies purpose ONLY.. Kossan among 4 kings of gloves stocks. Kossan have a potential breaking its all time high ( ATH ) Rm7.90 from coming “rally “..unlike others 3 kings ( harta, Topglove, supermx) its current downward wave structure from ATH seem “comprised of “ 3 waves structure which is (A)(B)(C) ( cyan/light blue). Meant its “correction” might be done soon BUT yet need to find its base first maybe @ around Rm0.90..

Kossan. Glove back to pre-covid growth. 5/May/22.Kossan latest report announced that : gloves ASP ( average selling price ) have been normalizing as the industry transitions to pre-pandemic levels.. AND..and they intend to expand its capacity by building new plants..As below of the chart. Kossan EPS ( earning per share also “normalized” back to pre-covid level but still “higher than previous all years before 2020.....” .As stock price always reflect prior to “fundamentals news” ..what do you think.????

KOSSAN RECHNICAL ANALYSIS5 hours ago
Technical analysis for KOSSAN Stock based on Trend Analysis, Chart Pattern and Fibonacci Retracement

KOSSAN maybe last leg up to≈ 3.800 before ≈2.70. 1/8/21KOSSAN possible forming a trip zig zag wave pattern as TOPGLOV chart. Where price currently both rebouncing for wave B (Cyan/Light Blue) of the wave Z (Red Circled) which is the last leg of of the triple zig zag (RED Circled wxyxz) pattern. The Next resistance for KOSSAN could be around RM3.80 which are 1) The down trend line of wedge pattern 2) Previous support becoming resistance zone

KOSSAN - Pre Consolidation breakoutTHIS IS NOT AN INVESTMENT ADVICE. TRADE CALLS ARE NOT PROVIDED. INFORMATION SHOWN ARE FOR TECHNICAL ANALYSIS PURPOSE.
DISCLAIMER
Please consider your own interpretation of Opportunity & Risk. The author of this post strictly follows the Malaysian Security Commission ( SC ) Guidelines on the prohibition of Investment Advice by unlicensed parties. Any examples shall use historical charts without any recommendations and not to cause inducement to the public to take action or position (e.g. buy, sell or hold) regarding a particular class, sector, or instrument in relation to securities or derivatives. The author will never provide any investment or trading advice as the activity of giving investment advice is likely to be considered as a regulated activity under the Capital Markets and Services Act 2007 ( CMSA ). All posts made in Tradingview do not include any communications involving providing recommendations or opinions or includes any material, content or any statement which are likely to induce a person to take any action or position (e.g. buy, sell or hold) regarding a particular class, sector, or instrument in relation to securities or derivatives that is likely to be considered as “advising others concerning securities or derivatives”. The author will not recklessly make any statement, promise or forecast that is misleading, false or deceptive to induce or attempt to induce another person to deal in securities or derivatives. None of information posted in post can be used as investment decisions. Do not trade solely on the information posted. Trade at your own risk and judgement. A trader could potentially lose all money. Only risk capital that can be lost without jeopardizing ones financial security of lifestyle. Please seek licensed professional guidance if you plan to invest your capital seriously.

Glove comeback?Could it be distribution TR forming?. Further confirmation is needed. Anticipating formation of AR and series of ST within upper range.

Glove stock in pursuit of ending downtrend?Could it be distribution TR forming?. Further confirmation is needed. Anticipating formation of series of ST within upper range.

Kossan Chart Major Support & ResistancePersonally, what I learnt is there must be a Technical Analysis Strategic Plan in order to increase the risk-to-ratios favourable risks.
1. Draw Support & Resistance
2. Identify the stages (Accumulation, Advancing, Distribution, Declining)
3. Entry Triggers
4. Stop Loss
5. Exits
I have learnt during my past mistakes that we should let the stock price comes to us, rather than us chasing the stock prices!


Kossan Chart Major Support & ResistanceTechnical Analysis
Personally, what I learnt is there must be a Technical Analysis Strategic Plan in order to increase the risk-to-ratios favourable risks.
1. Draw Support & Resistance
2. Identify the stages (Accumulation, Advancing, Distribution, Declining)
3. Entry Triggers
4. Stop Loss
5. Exits
I have learnt during my past mistakes that we should let the stock price comes to us, rather than us chasing the stock prices!

KOSSAN - 2 possible scenariosMYX:KOSSAN
1st - Range Trading. Entry near bottom range & TP near top range (~15%)
2nd - CL when the price break the support & target re-entry at the next RBS / bottom of downtrend line

KOSSAN - Potential ST Long (Learning Notes #12) (Paper Trade #1)Enter above RM 4.05
TP 1 RM 4.55
TP 2 RM 5.16
CL RM 3.75
Hello Traders,
I am currently learning Technical Analysis , and the ideas I post are what I call ("Learning Notes").
Comments on my analysis are very much welcome and will be greatly appreciated.
If you like my analysis, kindly drop a like and follow me! :)
Let us learn together, and grow together to be a better trader!
Sincerely,
Kenneth Lee
Disclaimer:
This is not a long/short recommendation, nor should it lead to any market actions and/or activities. Trade at your own risk.

LONG KOSSAN,Good Risk-to-Reward OpportunitiesFundamentally :
For Gloves Sector, Kossan we look at previous historical PE
2015 PE : 29.37
2016 PE : 25.03
2017 PE : 28.42
2018 PE : 27.63
2019 PE : 23.68
2020 FPE (Forward PE) prediction is roughly 6, current PE at 17.
No doubt, fundamentally at this price, and upcoming 2-3 quarters of expected breaking historical highs PAT for Kossan.
The risks to reward now to trade at these prices now is a no brainer~
Average Price Target by Analyst : 7.94 MYR, Represents 96% Upside.
It have dropped from Oct Peak about 50%, Fundamentals remain intact, infact is STRONGER due to Covid 19 sharp rise in cases worldwide.
Technical Analysis
Bullish Pin-Bar appeared today, Rebounded at Strong Major Support, Target Good Entry Point with good Risk-to-reward

Kossan Long at Major Support Swing TradingSwing Trading Kossan
The idea of swing trading is to capture ‘one move’ in the markets before the price reverse against you.
This is done by entering your trades from an area of value and exiting it before opposing pressure steps in.
Swing Trading Checklist :
1. Are you entering from an area of value?
a. Kossan : YES (Major Support Area)
2. Do you have a valid entry trigger?
a. Yes, Personally I will average buy in few trades in Major Support Area
3. Is your stop loss away from market structure?
a. Yes Low of the Major Support Line – 1 ATR
4. Is target profits within reasonable reach?
a. Yes, Good Risk to Reward Ratio
Area of Value can be Support & Resistance, Moving Average or Trend Line etc.
Entry Trigger can be Engulfing Pattern, Hammer, Shooting Star, False Break etc.
Target Profit can be at swing high, Support and Resistance area drawn on Kossan Chart.
Fundamentally :
For Gloves Sector, Kossan we look at previous historical PE
2015 PE : 29.37
2016 PE : 25.03
2017 PE : 28.42
2018 PE : 27.63
2019 PE : 23.68
2020 FPE (Forward PE) prediction is roughly 7, current PE at 19.
No doubt, fundamentally at this price, and upcoming 2-3 quarters of expected breaking historical highs PAT for Kossan.
The risks to reward now to trade at these prices now is a no brainer~

KOSSAN 14122020Open gapped down and closed low.
seeing potential go to support zone
4.00-4.50
overall still in bear mode.
No bull Price action , No Entry.

<TradeVSA> Kossan - Cluster of Closes in Mark-Up StageDaily Chart
1. Green Pentagon with Change of trend
- cross above 20 / 40 MA
2. Cluster of Closes with NS signal
Hourly Chart
3. Pullback with Spring and NS
Take note on Kossan-C13
Hit the "LIKE" button to support us :)
Disclaimer
This information only serves as reference information and does not constitute a buy or sell call. Conduct your own research and assessment before deciding to buy or sell any stock

KOSSAN: POTENTIAL TESTING R1 & R2SHORT TERM LONG. STOCK MOVEMENT STILL FOLLOWING UPTREND TRENDLINE & MOVING AVERAGE EXPONENTIAL STILL ON BULLISH CROSS. POTENTIAL TESING R1 & R2 ON SHORT TERM.
TAYOR!

