LCTITAN - The LOW is getting HIGHER !LCTITAN - CURRENT PRICE : RM0.470
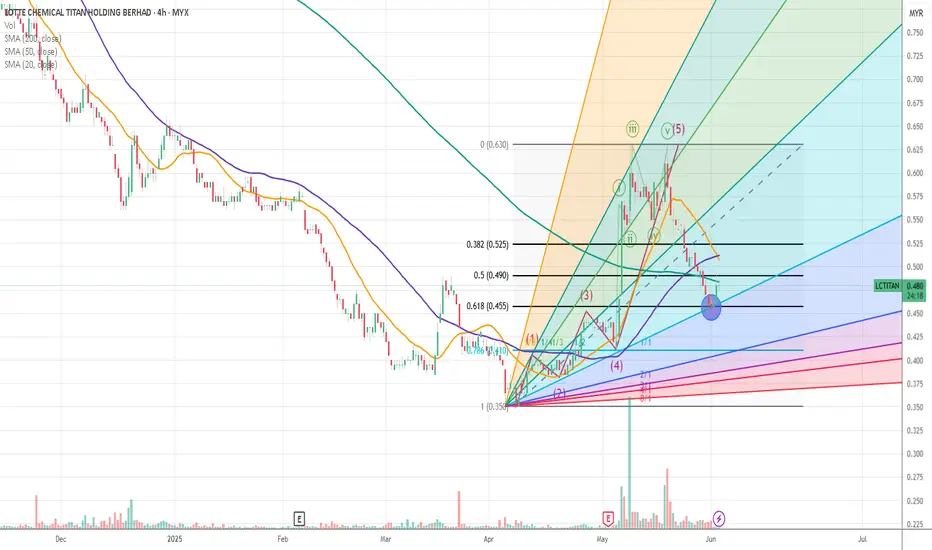
The stock made a HIGHER LOW recently - this may consider as a half portion of new uptrend is completed. A breakout above RM0.630 will form the higher high structure - which confirm the new uptrend phase.
For short term trading purposes, short term traders may anticipate to buy if the stock breakout nearest resistance of RM0.520 - which will give an entry point at RM0.525. So this is a pending breakout stock. Nearest target will be RM0.580 and RM0.620. Take note that when the price breakout RM0.520 , it will also be above EMA 50 and ICHIMOKU CLOUD - which strengthening the bullish outlook.
ENTRY PRICE : RM0.525
TARGET : RM0.580 and RM0.620
SUPPORT : EMA 50
Notes : The higher low structure of LCTITAN looks like DRBHCOM - I share the link here for reading purposes.
LCTITAN trade ideas

LCTITAN retrace 2nd wave before SUPER 3rd waveretracement happens at 0.618
got volume spike after earnings announcement
quarter loss is improving, likely will turn to black (profitable) next quarter
we'll see whether will follow gann fan or not
LCTITAN, can bull continue the trend?It was big vol on previous trading.
It seems may pullback soon.
>> Holder, set right trailing stop loss.
>> Personally will wait for pullback and proper signal if want to EP.
>> Need to stay intact with the Hull MA (green) if want continue the rally.
When the market moves where, and how, and if - these are all unknown. The only thing which we can control is our risk. Focus on risk management!
Keep the long term vision.
Disclaimer: Mentioned stocks are solely based on own opinions for education and/or discussion purpose only. There's no buy and/or sell recommendation. Trading involve financial risk on your own. The author shall not be responsible for any losses or lost profits resulting from investment decisions based on the use of the information contained herein.

LCTITAN - begining of Pullback ?Investors disappointed with the latest QR?
Or due to TA itself?
Broken parallel channel. Not a good sign.
On the way to deep Blue Sea.
Disclaimer: Mentioned stocks are solely based on own opinions for education and/or discussion purpose only. There's no buy and/or sell recommendation. Trading involve financial risk on your own. The author shall not be responsible for any losses or lost profits resulting from investment decisions based on the use of the information contained herein.

End of Declining Phase!The candlestick indicates a divergence pattern where the pattern is in the declining phase and is already at the end of the cycle. With the possibility of beginning the phase for accumulation.
For a long investment strategy trader, then this is a sign to enter and ride to the next peak price; R1.
Let's save LCTITAN in WL and watch out for significant price movement efforts with result in a large volume compared with the previous day or above the MA line.
R 1.25
S 0.95

Selling Climax Pattern!The candlestick signs a weak demand. Hence, a downtrend pattern emerged where the price closed below the S1 line due to a price being pushed down by a strong Bearish pressure. A strong counterattack of Bullish pressure is required to break the decline. As a result, when "Smart Money" is in need to break a strong decline, they have to put a lot of buying pressure and strong volume surge.
MACD and RSI confirm the price downtrend pattern.
The S2 line will be the next low price if the price steadily declines due to weak demand from the buyer.
Let's save LCTITAN in WL for the possibility of a reversal up signal could be expected.
S1 1.25, S2 1.10, S3 1.00

LCTITAN 5284 catch the BottomCATCH THE BOTTOM !!!
1. the banker chips in the downtrend
2. the energy indicator show the divergence
3. the bbd indicator crossover 0 line, short term buying chance
4. stop loss point set at the lowest low of pivot point
there is no sell signal yet, so still can hold the share counter. but the re band is the long term resistance, so it is not recommend to buy it at this price.


PENDING SLOW TURTLE BUY ON BREAKOUTMYX:LCTITAN
Pending slow turtle buy
big picture rounding bottom
target price at gap fill area

LCTITAN TECHNICAL ANALYSISTechnical analysis for LCTITAN Stock based on Trend Analysis, Chart Pattern and VPA

LCTITAN SHORT TERM SET UPMy plan as stated in chart by using Falling wedge and Crab Harmonic pattern for target around 1.618% at point D.
#TAYOR MYX:LCTITAN


LCTITAN - Trend repeated ?Chart tell you the next story .. fibo ur self 1.68 2.68 .. you know where to go ..

LCTITAN Short Base VCPAnother short base VCP observed.
C1: 17%
C2: 7%
C3: 5%
Huge volume during the price surge before May and super dry volume during price contraction in May.
Let's see if how the development in June!
Fundamental wise: NTA 5.48!
Similar to MMC where the share price much lower compare to the NTA. Can refer back my previous MMC VCP sharing in the link below.
Disclaimer:
The content provided is my personal experience sharing through technical and fundamental analysis point of view. The content can only be used for education purposes and NOT any recommendation for buying or selling stock. Please ask your remiser/dealer for making decision. Trade at Your Own Risk.


LCTITAN - Pre Consolidation BreakoutNO INVESTMENT ADVICE IS PROVIDED
DISCLAIMER
Please consider your own interpretation of Opportunity & Risk. The author of this post strictly follows the Malaysian Security Commission ( SC ) Guidelines on the prohibition of Investment Advice by unlicensed parties. Any examples shall use historical charts without any recommendations and not to cause inducement to the public to take action or position (e.g. buy, sell or hold) regarding a particular class, sector, or instrument in relation to securities or derivatives. The author will never provide any investment or trading advice as the activity of giving investment advice is likely to be considered as a regulated activity under the Capital Markets and Services Act 2007 ( CMSA ). All posts made in Tradingview do not include any communications involving providing recommendations or opinions or includes any material, content or any statement which are likely to induce a person to take any action or position (e.g. buy, sell or hold) regarding a particular class, sector, or instrument in relation to securities or derivatives that is likely to be considered as “advising others concerning securities or derivatives”. The author will not recklessly make any statement, promise or forecast that is misleading, false or deceptive to induce or attempt to induce another person to deal in securities or derivatives. None of information posted in post can be used as investment decisions. Do not trade solely on the information posted. Trade at your own risk and judgement. A trader could potentially lose all money. Only risk capital that can be lost without jeopardizing ones financial security of lifestyle. Please seek licensed professional guidance if you plan to invest your capital seriously.


LCTITAN - TRIANGLE BUY ON DIPLCTITAN ,undervalued, cash rich and exceptional fundamentals.
Recent extreme increase of resin prices, LCTITAN will command high profit margins.
Beware of the QR Bomb
Points of Interest ( FIBO ) :
R1 2.700 (FIBO+Triangle Upper Line)
R2 2.800
R3 2.980
S1 2.450
S2 2.350


LCTITAN: Rebound at channel + EMA200? LCTITAN looks to stay and sustaining above EMA200 + possible rebound at support in the uptrend channel. Could we see the price to hit the upper uptrend channel? Well we hv to see! #TAYOR

LC TITAN ANALYSISCHECKLIST
RSI250 > 50 = Checked
DMI ADX PINK >20 = Checked
SMART MONEY = Thick
CROSS DEATH = Buy Singal
MACD =Almost cross
Best time to entry

LC TITAN ANALYSISMA Golden Cross for LC Titan
Fundamental Analysis
Market Capital (RM) : 6.577b
Number of Share: 2.308b
EPS (cent): 8.02 *
P/E Ratio: 35.54
ROE (%): 1.53
TTM Profit Margin (%): 2.7
CAGR - Revenue (%): -
CAGR - PAT (%): -
Business+: 0
YoY Score: 0
QoQ Score: 0
Dividend (cent): 7.000 ^
Dividend Yield (%): 2.46
Dividend Policy (%): 0
NTA (RM): 5.250
P/B Ratio: 0.54
TAYOR
