M&G - Analysis on price movementY wave, target (E) within stipulated range.
N wave with V, N & E projection. Golden cross may happen if there is a strong momentum to push the price upward.
R - 0.410 (52w high)
S1 - 0.340 (Tenkan sen)
S2 - 0.320 (Senko span B)
Note:
1. Analysis for education purposes only.
2. Trade at your own r
0.020 MYR
44.12 M MYR
352.23 M MYR
719.44 M
About MARINE & GENERAL BERHAD
Sector
Industry
Website
Headquarters
Kuala Lumpur
Founded
1996
ISIN
MYL5078OO000
FIGI
BBG000C86P06
Marine & General Bhd. operates as an investment holding company, which engages in the tolled highway concessionaire and the provision of offshore marine support services. It operates through the following segments: Marine Logistics-Upstream, Marine Logistics-Downstream, and Investment Holding & Others. The company was founded on October 14, 1996 and is headquartered in Kuala Lumpur, Malaysia.
Related stocks

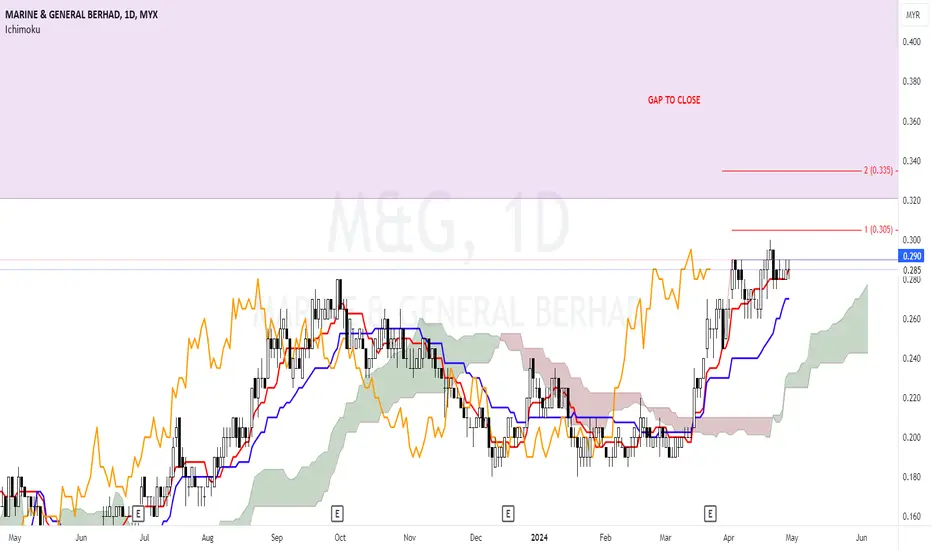
M&G - Estimation of price movement"Is there strong momentum to break the resistance at a price of 0.290? If breakout, the next levels are at 0.305 and 0.335. Over the past few days, the price has been hovering around the Tenkan Sen, which acts as support."
note:
Just a study for learning purposes.
Trade at your own risk.
M&G triggers MRV1 on 8 Jan 2023 at the price of RM0.230 at closi
This is repeated signal, as the previous signal was triggered on 26 Dec 2023 when the share price was RM0.220
The support level for M&G is RM0.220, but a safer stop loss would be RM0.195, which is also the previous equilibrium support.
The resistance level for M&G is RM0.250, followed by RM0.2

M&G, operators will keep push this counter?>> price reach middle of Parallel Channel
>> Stochastic at OB
>> Potential bearish divergence will pull down the price
° holder should protect own profit / capital.
° prepare to run when Hull MA turn red
° run immediately when broken the said Parallel Channel .
Disclaimer : I am not an attorney,

M&G trendline Based on the uptrend line and EMA20 line analysis, it appears that M&G is in a consolidation phase after a recent uptrend. The stock is currently trading below its EMA20 line, but the EMA20 line is trending upward, which suggests that the stock could soon start to move higher again. The uptrend line

M&G trendlineBased on the uptrend line and EMA20 line analysis, it appears that M&G is in a consolidation phase after a recent uptrend. The stock is currently trading below its EMA20 line, but the EMA20 line is trending upward, which suggests that the stock could soon start to move higher again. The uptrend line

M&G Bullish MomentumM&G if based on Monthly Chart Showing That Momentum Bullish is starting based on Breakout at 0.245 and if need to maintain above this Price. Hearsay on market said that there are bullish view that this company will be turn to be very Succesfull year in 2023 and 2024. Book Value will be up significan

Marine & General Analysis - LongExpecting a long position after a technical rebound from fib level 0.382 (Reverse fib retracement) at price 0.12.
Target TP at 0.25 at fib level 1.618.
Possible to drop again before start the next wave as not enough buying momentum.
Not a buy/sell call. DYOR. Thank you.

M&G CUP AND HANDLE PATTERN SPOTTEDM&G Cup and handle pattern has emerged on the Daily chart with completion of the right side handle.
Potential upside if price to head towards cup's rim.


See all ideas
Summarizing what the indicators are suggesting.
Oscillators
Neutral
SellBuy
Strong sellStrong buy
Strong sellSellNeutralBuyStrong buy
Oscillators
Neutral
SellBuy
Strong sellStrong buy
Strong sellSellNeutralBuyStrong buy
Summary
Neutral
SellBuy
Strong sellStrong buy
Strong sellSellNeutralBuyStrong buy
Summary
Neutral
SellBuy
Strong sellStrong buy
Strong sellSellNeutralBuyStrong buy
Summary
Neutral
SellBuy
Strong sellStrong buy
Strong sellSellNeutralBuyStrong buy
Moving Averages
Neutral
SellBuy
Strong sellStrong buy
Strong sellSellNeutralBuyStrong buy
Moving Averages
Neutral
SellBuy
Strong sellStrong buy
Strong sellSellNeutralBuyStrong buy
Displays a symbol's price movements over previous years to identify recurring trends.
Frequently Asked Questions
The current price of M&G is 0.160 MYR — it has increased by 3.23% in the past 24 hours. Watch MARINE & GENERAL BERHAD stock price performance more closely on the chart.
Depending on the exchange, the stock ticker may vary. For instance, on MYX exchange MARINE & GENERAL BERHAD stocks are traded under the ticker M&G.
M&G stock has fallen by −5.88% compared to the previous week, the month change is a −21.95% fall, over the last year MARINE & GENERAL BERHAD has showed a −54.93% decrease.
M&G stock is 6.25% volatile and has beta coefficient of 0.45. Track MARINE & GENERAL BERHAD stock price on the chart and check out the list of the most volatile stocks — is MARINE & GENERAL BERHAD there?
Today MARINE & GENERAL BERHAD has the market capitalization of 124.94 M, it has decreased by −5.56% over the last week.
Yes, you can track MARINE & GENERAL BERHAD financials in yearly and quarterly reports right on TradingView.
M&G net income for the last quarter is 17.61 M MYR, while the quarter before that showed 2.55 M MYR of net income which accounts for 589.58% change. Track more MARINE & GENERAL BERHAD financial stats to get the full picture.
No, M&G doesn't pay any dividends to its shareholders. But don't worry, we've prepared a list of high-dividend stocks for you.
EBITDA measures a company's operating performance, its growth signifies an improvement in the efficiency of a company. MARINE & GENERAL BERHAD EBITDA is 139.80 M MYR, and current EBITDA margin is 40.65%. See more stats in MARINE & GENERAL BERHAD financial statements.
Like other stocks, M&G shares are traded on stock exchanges, e.g. Nasdaq, Nyse, Euronext, and the easiest way to buy them is through an online stock broker. To do this, you need to open an account and follow a broker's procedures, then start trading. You can trade MARINE & GENERAL BERHAD stock right from TradingView charts — choose your broker and connect to your account.
Investing in stocks requires a comprehensive research: you should carefully study all the available data, e.g. company's financials, related news, and its technical analysis. So MARINE & GENERAL BERHAD technincal analysis shows the sell today, and its 1 week rating is strong sell. Since market conditions are prone to changes, it's worth looking a bit further into the future — according to the 1 month rating MARINE & GENERAL BERHAD stock shows the sell signal. See more of MARINE & GENERAL BERHAD technicals for a more comprehensive analysis.
If you're still not sure, try looking for inspiration in our curated watchlists.
If you're still not sure, try looking for inspiration in our curated watchlists.