M&G - Analysis on price movementY wave, target (E) within stipulated range.
N wave with V, N & E projection. Golden cross may happen if there is a strong momentum to push the price upward.
R - 0.410 (52w high)
S1 - 0.340 (Tenkan sen)
S2 - 0.320 (Senko span B)
Note:
1. Analysis for education purposes only.
2. Trade at your own risk.
M&G trade ideas

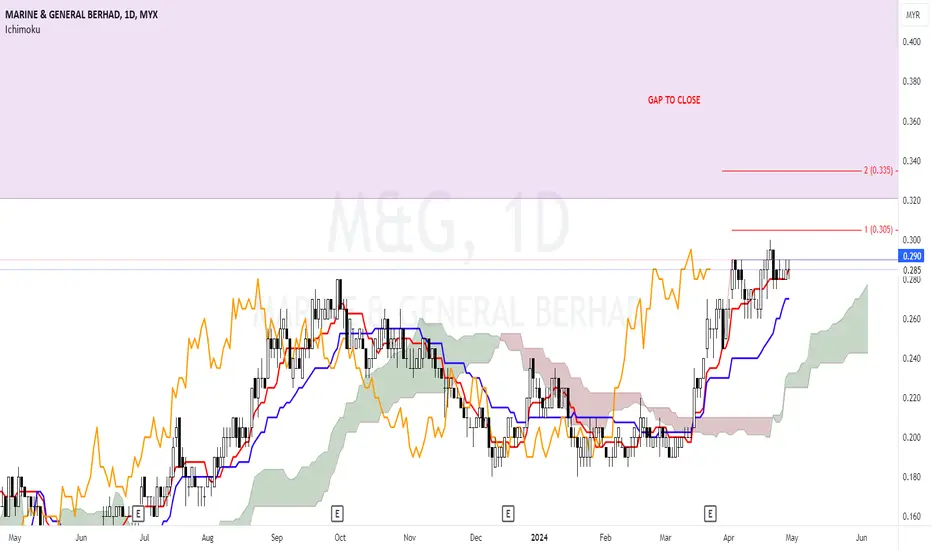
M&G - Estimation of price movement"Is there strong momentum to break the resistance at a price of 0.290? If breakout, the next levels are at 0.305 and 0.335. Over the past few days, the price has been hovering around the Tenkan Sen, which acts as support."
note:
Just a study for learning purposes.
Trade at your own risk.
M&G triggers MRV1 on 8 Jan 2023 at the price of RM0.230 at closi
This is repeated signal, as the previous signal was triggered on 26 Dec 2023 when the share price was RM0.220
The support level for M&G is RM0.220, but a safer stop loss would be RM0.195, which is also the previous equilibrium support.
The resistance level for M&G is RM0.250, followed by RM0.275, but the target price is set to RM0.270 to ensure a good risk/reward ratio of 1:2.
The holding period for this trade is estimated to be 2-3 months, based on the daily chart analysis.
This information is for discussion purposes only and is not a buy/sell call.

M&G, operators will keep push this counter?>> price reach middle of Parallel Channel
>> Stochastic at OB
>> Potential bearish divergence will pull down the price
° holder should protect own profit / capital.
° prepare to run when Hull MA turn red
° run immediately when broken the said Parallel Channel .
Disclaimer : I am not an attorney, accountant or financial advisor, nor am I holding myself out to be, and the information contained here not a substitute for financial advice from a professional who is aware of the facts and circumstances of your individual situation.

M&G trendline Based on the uptrend line and EMA20 line analysis, it appears that M&G is in a consolidation phase after a recent uptrend. The stock is currently trading below its EMA20 line, but the EMA20 line is trending upward, which suggests that the stock could soon start to move higher again. The uptrend line is also providing support for the stock, which suggests that the uptrend is still intact.

M&G trendlineBased on the uptrend line and EMA20 line analysis, it appears that M&G is in a consolidation phase after a recent uptrend. The stock is currently trading below its EMA20 line, but the EMA20 line is trending upward, which suggests that the stock could soon start to move higher again. The uptrend line is also providing support for the stock, which suggests that the uptrend is still intact.

M&G Bullish MomentumM&G if based on Monthly Chart Showing That Momentum Bullish is starting based on Breakout at 0.245 and if need to maintain above this Price. Hearsay on market said that there are bullish view that this company will be turn to be very Succesfull year in 2023 and 2024. Book Value will be up significantly. So for Now Technical View
SUPPORT 1: 0.24
SUPPORT 2: 0.21
RESISTANT1: 0.27
RESISTANT2: 0.31
RESISTANT3: 0.34
CUTLOSS : 0.235 If Entry around 0.24
TIGHTHEN YOUR SEATBELT

Marine & General Analysis - LongExpecting a long position after a technical rebound from fib level 0.382 (Reverse fib retracement) at price 0.12.
Target TP at 0.25 at fib level 1.618.
Possible to drop again before start the next wave as not enough buying momentum.
Not a buy/sell call. DYOR. Thank you.

M&G CUP AND HANDLE PATTERN SPOTTEDM&G Cup and handle pattern has emerged on the Daily chart with completion of the right side handle.
Potential upside if price to head towards cup's rim.


