MAHSING - BULLISH HAMMER CANDLESTICK ?MAHSING - CURRENT PRICE : RM1.81
MAHSING is bullish as the share price is above 50 and 200 days EMAs. After declining for two days, today the stock made a bullish hammer candlestick. This scenario may indicate that potential bottom had reached. Aggresive trader may decide to buy on this hammer candle.
ENTRY PRICE : RM1.79 - RM1.81
TARGET PRICE : RM1.92
SUPPORT : RM1.74 (the low of hammer candle)
Notes : MAHSING forged key partnerships with Bridge Data Centres (BDC) to drive the development of state-of-the-art data centre facilities. The Mah Sing DC Hub@Southville City, Bangi currently holds 300 MW of secured power capacity, with an additional 200 MW earmarked for future collaborations, solidifying its role as a major regional data centre hub.
MAHSING trade ideas
MAHSING Break Out Technical Analysis
Break out of Ascending Triangle Pattern
Uptrend on the MACD volume
Short Term Trading
Wait for retest of Support Area ( White Zone ) and enter long once rebound from support area.
TP on 2.16 ( 19.34% Gain )
SL on 1.67 ( 7.73% Loss )
Record Holding
0 Stock hold as of now.
MAHSING, potential Buy based on AlgoSignal StrategyThe current price exhibits promising upward signals according to my algorithmic system, meeting various criteria. These include rising trading volume, an upward trend indicated by prices above EMA20 and EMA50, and the closing price surpassing VWAP. As a result, the present conditions suggest a potential upward trend.
MAHSING, potential Buy based on AlgoSignal StrategyThe current price exhibits promising upward signals according to my algorithmic system, meeting various criteria. These include rising trading volume, an upward trend indicated by prices above EMA20 and EMA50, and the closing price surpassing VWAP. As a result, the present conditions suggest a potential upward trend.
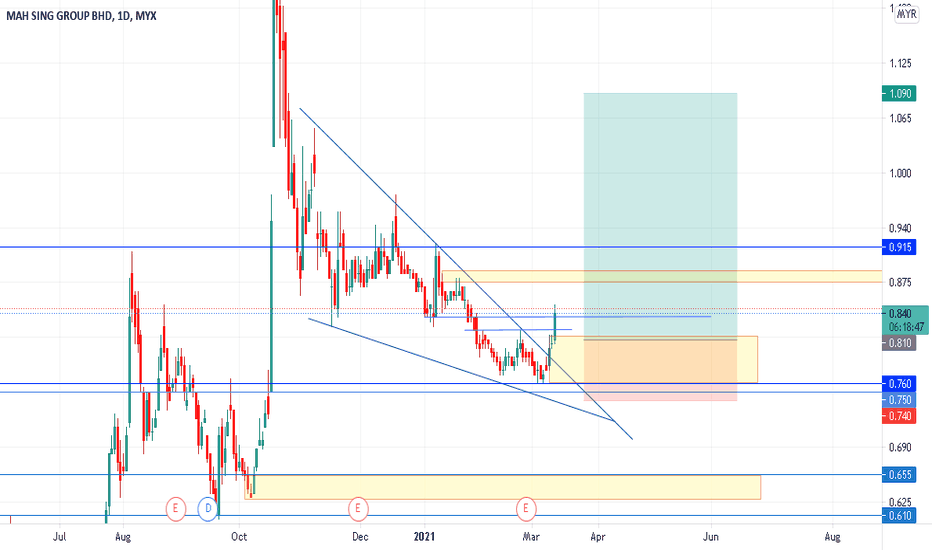
Mahsing (BURSA WK44 2021)Bottom build up (higher high & higher low) is completed, and price is already above MA5, 10, 20 and 60.
Last friday closing, its price has slightly drop but the bullish trend is still going unless the price is unable to cross @0.84.
There has a resistance at 0.84 level and consolidation between 0.81 to 0.84 which is also a resistance zone.
====================================================================================================================
I am a profitable trader, here is the watchlist for BursaMalaysia Market.
-TGL Engineered Excellence-
TR 381. Mahsing weekly in uptrend. EMA 20 above EMA 50. Price action just above EMA 200.
2. In H4, it is expected to be in Wave 4 where reversal after ABC at 0.382 Fibonacci level (previous reversal also at 0.382). Doji formed and broken with bullish candle.
3. From Isaham, Profit and Revenue uptrend, PE 22.7, WAFV RM0.92
Long period of base and filled the gap- it went through a long period of consolidation - one could have swing traded this because of healthcare related investment
- 875 was the obvious entry for this stock with 855 as the cut lost point
- the gap up today filled the gap down in last November 2020
- closed above the box and give it a few more days to establish a stronger support
- long upper shadow indicates a strong profit taking from those who trapped last year
**the analysis is solely for my own references and learning


