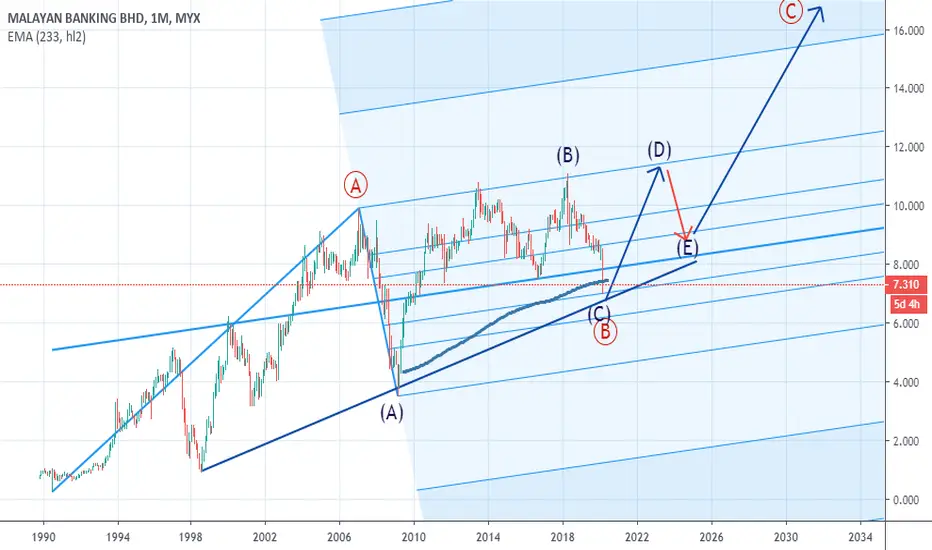
MAYBANK trade ideas


MAYBANK shortterm waves updated 18 June 2020Detail @ The Chart..p/s Inside any impulsive, there is ONLY abc waves not 1,2,3,4,5 waves.....

MAYBANK Bull is in charge! sl @ 17 March 2020 lo, TP above 11.08Detail @ The Chart. P/s inside any impulsive wave there is ONLY abc waves


MAYBANK - MALAYSIA STOCKMYX:MAYBANK
So someone asked me what bank good for investment right now.
So as you can see Maybank and CIMB is very undervalued right now. Both bank have good historical performance and very low risk.
I prefer Maybank because they giving much more dividend.

Maybank is interested to test The main Trendline @ RM6.5It could be the best price level to buy and to keep for a few years.
The economy is not collapsing yet,
just a little hiccup caused by a global pandemic
But if it breaks the Trendline then I'll recommend every investor to increase their Gold Reserves quickly.


[MAYBANK SHARE ANALYSIS] Impact from Coronavirus and OPR CutMaybank shares continue to be under pressure.
With the announcement of the cutting of OPR, expect the banking stocks will continue to drop due to lower interest income.
Plus the Coronavirus effect, Maybank will expect to go lower in the coming weeks or even months.
Technical chart-wise, we can see that it is on the downtrend still.
The share price of Maybank is below MA 50.
MA 50 is below MA150, and MA 150 is below MA 200.
Long term downtrend is still intact.
There are not many catalysts to push the price higher.
MACD is on the downtrend as well.
Heikin Ashi Candlestick Technical Analysis Charts
For Heikin Ashi, all the candlesticks in showing downtrend signal.
Suggest investors to monitor and wait until Maybank share shows sign of reversal.

1155 Maybank Currently backtesting mega support line1155 Maybank - Currently backtesting mega support line, similar to year 2008 and 2016. Current price at RM8.6 is the launchpad to next higher high price level. Overall, Maybank is a gigantic bullish wedge spanning more than 10 years.


Maybank Head and Shoulder BreakdownThe largest market cap in the Bursa market have formed a classic chart pattern breakdown with formation target at 7.125.
Price level 9.10 have used as neckline instead of June 2018 low. The reason underlying by two symmetrical shoulder (left and right) ended and started development from this price level.

MAYBANK Technical Analysis 11/04/2019MYX:1155
Since Jul 2018, MAYBANK had entered into sideway after sharp declining from RM 10.88 to RM 9.00 in 1 month time. Since then, MAYBANK is trading within RM1.00 range (RM 9.00 - RM 10.00).
From my graph, as you can see, the MAYBANK is in a short term downtrend (A1 & B1 line). And in Mar 22, it had breakout downward of the short-term upward triangle pattern (A1 & B1 to C1).
Thus, I would suggest that MAYBANK will remain sideway within the short term downward range, however, the MACD had just golden cross at the bottom and we should expect a small rebound in the next few trading days.
DISCLAIMER: JUST FOR SHARING PURPOSE. NO BUY OR SELL CALL INTENDED.


MAYBANK (1155): MALAYAN BANKING BHD For Education Purpose ONLY
Murphy's law : "Anything that can go wrong will go wrong". So?!! Cut lost , cut lost AND CUT LOST!! If anything wrong!
P/S: Unlike conventional, To have consistent elliot wave counts,there is ONLY 3 subwave ( abc ) counts on ANY Impulsive wave (1,3,5) VS coventional counts which is 5 subwave (1,2,3,4,5)

MAYBANK (KLSE: 1155)Attached is the updated Technicals for MAYBANK -- The Donovan Norfolk Rated Top Bank of Entire Malaysia KLSE. The 3 dark green circled regions are my live calls in January 2016, 1H-2016 and 2H-2016 to buy bank stocks all over the world. Back in 2016, the herd were shouting for market crash and a bear market because the FED rate hikes caused a massive fear and markets were selling off.

Maybank Berhad The 3 dark green circled regions are my live calls in January 2016, 1H-2016 and 2H-2016 to buy bank stocks all over the world. Back in 2016, the herd were shouting for market crash and a bear market because the FED rate hikes caused a massive fear and markets were selling off. Singapore was to have technical recession back in 2016 too, and I was calling for bank stocks' buys.
Most of the followers are now sitting on more than +50% profits for Maybank and their profits will blossom into +100% in the coming resumption of world bank stocks' super rally (see cross reference link attached at the bottom of this analysis).
The first yellow trajectory measures $3.80 on linear scale and +55% on logarithmic scale. This means the next wave of banks' super rally worldwide will bring Maybank to $12.40 conservative target on the linear scale, and $13.33 logarithmic target on the logarithmic scale. MayBank may then rest slightly and proceed for probing of prices beyond $13.33 in the secular bull market.
Additional Note:
Worldwide bank stocks are expected to shoot through the roof in 2H-2018 and 2019. More waves of super rally in equity markets can be expected in 2H-2018, 1H-2019 and 2H-2019 -- amidst the backdrop of 80% market majority having the conviction of a bear market coming.
