MELEWAR - Analysis on price movementExit & Entry strategy setup. Awaiting at T3 for potential entry. Price is above Tenkan Sen, Kijun Sen and up Kumo. Need momentum to breakout 52w high (0.325) to reach the target price.
None:
1. Analysis for education purpose only.
2. Trade at your own risk.
MELEWAR trade ideas

MELEWAR triggered based on MRV1 on closing 15 Dec 23Buy signal triggered based on MRV1 setup at RM0.275;
20% target at RM0.330; stop loss at RM0.245;
2-3 months due to the signal based on the daily timeframe.
**Only for discussion purposes. Not a buy / sell call.


Melewar is Showing Upward BiasMelewar is related to steel manufacturing holding company.
Steel / metal price had been down lately due to China Economy Restriction (zero covid policy). As recently the Dollar index is down and China is easing their economy restiction, steel or metal is among the sector which should benefit from it.
Looking at the chart, there had been buying activities recently in steel counters. Melewar is showing that Flag Pattern might playout in near future.
We can see from 11 Nov to 21 Nov there had been massive buying activities which had lead to a very convincing upward move.
Then we can see it is consolidate to today in a flag pattern.
Tailwinds:
China opening economic activities.
Headwinds:
Recession fears as Fed Reserve is doing Monetary Thightening to battle inflation.
The consolidation is nearing its end,
1) If buyers dont step in, then sellers will take charge. Thus, the next Support will be at 0.260.
2) If it could make a breakout, then the next resistance is at 0.320 followed by 0.375.
Disclaimer:
This is not a Buy / Sell call. This material is for learning purposes only. Trade at your own risk.

Melewar trend changing?From my point of view. But due to current situations, anything could happen.
Tayor

A Breakout Signal!The price trendline indicates a price breakout signal due to significate price movement with volume above the MA20 line. The MA20 line cross over the MA50 line, hence, indicating a strong uptrend price momentum to the next price resistance.
The RSI indexes momentum towards the next indexes peak; indexes 70. This confirms the significate price momentum.
MACD and OBV indicate a divergence signal. Thus, confirming the price movement and RSI indexes.
Precaution for price correction between 10% - 20% from the recent peak before the price continues t the next price resistance.
Let's save MELEWAR in WL and watch out for price movement towards the next price resistance with volume.
R 0.450
S 0.385

MELWEWAR IN HEAD AND SHOULDERS PATTERNConsider to study and monitor MELEWAR spotted in what appears to be an inverted Head and Shoulders Pattern. Proposed EP at 4htf pivot point and CL below right shoulder. Proposed TP is height of bottom of head to neckline.

WHERE MELEWAR SHOULD GO? NICE TO SHAREMYX:MELEWAR
1. if breakout trendline at 0.415, can monitor.
2. Steel sector

Melewar: Long position towards 0.610I will take a long position price between 0.530 - 0.535 towards target 0.61 & 0.675 in extension.
Reason: Price is still above 200 ema & 52 ema indicates long signal still valid.
TAYOR


MELEWAR - End of Bullish SpectrumMELEWAR
Theme: Steel
Rst: 0.775
Spp: 0.71
Arrived the end of Fibo Ext spectrum, and latest candlestick build had tested 3 times the strong resistance at 0.775 but failed to break through, which can be deemed as significant weakness, expecting pullback to follow.

MELEWAR 3778 Trend Breakout The study...is based upon Volume Price Spread Analysis and Momentum
Melewar has shown both Trend Breakout with Momentum
Close: 0.60
EP: 0.62<
SL: 0.52/0.47
TP: 0.69/ 0.77/0.81/open
*The last 2 Quarters the Company had shown consecutive increment in both Revenue and Net Profit. The current NTA stands at 0.96 which is more than 30% discount.
Disclaimer: This study does not constitutes Buy/Sell per say. Please consult your financial advisor before making any trading/investing decision

MELEWAR : The rally continues (Medium term - Wave analysis)A lot of steel names were seen rallying strongly today and managed to hold their gains up to weekly close. One particular steel stock that caught our eyes is MYX:MELEWAR . After making explosive gains at the end of Dec 2020, the stock has been consolidating for 16 weeks in a contracting triangle corrective pattern of wave (iv) as labelled on the chart. Today we saw a strong breakout from the descending trendline of the triangle with huge volume signaling the start of wave (v) of a larger degree wave iii. Based on our wave analysis, we are bullish on MYX:MELEWAR and in the verdict that the stock could potentially move higher towards RM1.15. The next resistance is where wave (iii) has terminated which is RM0.620 and nearest support at RM0.540.

Bullish SteelBullish bias emerged above the symmetrical triangle pattern . As such, the stock may head north to test the next resistance of 0.805, followed by 0.93. Meanwhile, a reversal to below 0.475 would negate this expectation.
Disclaimer: No trading strategy provided here. Our content is intended to be used and must be used for technical analysis education purposes only

Ride wave 5 MelewarThis is not investment advice. Please do your due diligence.
Triangle usually happen at wave 4 or wave b in elliot wave. In this case, its wave 4.
Expected to complete wave e tomorrow before breakout to upside.
Target showed in the diagram. This count will be invalidated if price touch 0.45 before completing wave 5.
Goodluck.
#AbangCak
#ElliotWaveTrader

MELEWAR is trading in boxMELEWAR is trading in uptrent but it stuck in trading box A.
Should it penetrate Box A it has 2 probabilities. If it cannot pass the resistance it might pull back to its support
in Box B (0.455).
If it can break Box A it will try to break Box B. If it can break Box B it will test its major resistance at 0.620.


MelewarTrade ideas for this counter.
Wait at green zone as hidden zone at lower TF detected.
Happy Trading
TAYOR

Melewar - Comply Triangle PatternBeen monitoring this stock whether it ll comply the triangle pattern. By drawing the the support and resistance line (triangle pattern), we can see at the end a big volume and breakout is seen.


MELEWAR AnalaysisDisclaimer: This is not a buy call but for learning purpose
Technical Analysis
Price above MA40
Volume OK
Potential rebound at MA line
RSI above 50
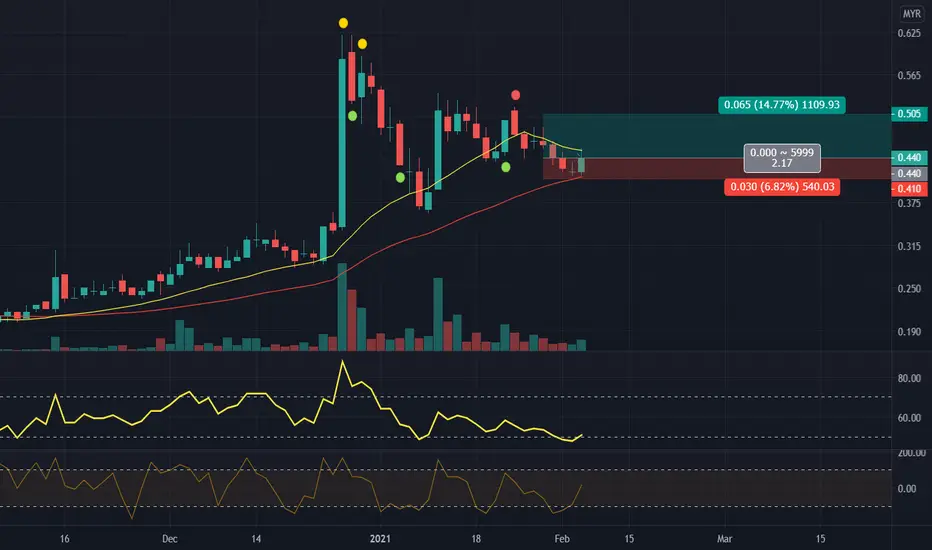

Will Melewar Break Out Following its Sector Trend?Melewar looks like ready to follow metal sector to go higher. QR expected to be announced around this coming 27th or 28th of Feb 2021.
Previous QR was showing good improvement as below,
Q3 20 = -2.7million, -1.9% of revenue
Q4 20 = 3.4million, +3.37% of revenue
Q1 21 = 7.4million, +4.7% of revenue
If the QR keep improving, it will easily break the triangle pattern.
Other stock related sector to see,
LIONIND, MASTEEL
