MMAG MARKING UPTypical Re-Accmulation pattern #2 The Rising Bottom
In view of formation feather's weight & possible SpringBoard (Yellow Color)
i always buy on strength , seldom on weakness
-but looks like , institutions have interest for MMAG.
Position intiated as attached
MMAG trade ideas


MMAG: 0.40Mmag is on new bullish trend development. I'm expecting it will move higher in mid term targetting 0.40 soon.
Tayor!

MMAG, whatever up will downMayday for MMAG?
Can short at Bursa? If not, better don't catch the falling knife.
The stock market is a highly dangerous place.
Get in, take your profit and get out quick!
If no profit, protect downside and run!!!
Disclaimer: Mentioned stocks are solely based on own opinions for education and/or discussion purpose only. There's no buy and/or sell recommendation. Trading involve financial risk on your own. The author shall not be responsible for any losses or lost profits resulting from investment decisions based on the use of the information contained herein.


The Burj KhalifaEnded the game at Fibonacci 6.86 with V-TOP pattern. Price steadily moving below Fibonacci 1.618.
History repeat itself
Disclaimer: No trading strategy provided here. Our content is intended to be used and must be used for technical analysis education purposes only.


MMAG Mid Term SetupSetup strategy:
Wait for price to test on green support zone for better risk and reward ratio, as strong downward pressure is still on the way from Monthly chart.
RSI index at neutral.
Price at Bolinger Band Mean line.
Remarks from author
1)This analysis does not represent long or short trade immediately, it is solely on the author analysis
2)Trade at your own risk with proper lot sizing and follow your own trading plan
3)Risk management is always be the top priority

EASY123 Prediction @MYX MMAGPrediction: BOX/Sideway Pending Breakout immediate R0.515 (Rally when it breaks 0.56)
Target Price: R1=0.555-0.58, R2=0.63-0.68 , R3=0.77-0.83
Support/Cut Loss: S1=0.44, S2=0.38
*Trend direction: BOX Pending Breakout - Rally when breaks immediate R0.515
*Yellow-Diamond( BT ) have appeared on 30-Oct, an indication of the bottom.
*Price breaks, stand above & supported by our Lifeline (Redline), an indication of an uptrend.
*Candle has turned from Red to Blue color on 13-Nov, an indication of Uptrend reversal.
*Power volume (Red volume ) appeared on 12,13 & 16-Nov, an indication of the presence of big players.
*Disclaimer: This is not a Buy or Sell suggestion but solely sharing the information...Trade at your own risk.
*Preference Strategy: Swing trading (Follow the BUY/SELL Signal respectively).
*Reminder TP & CL is an individual preference & decision. No fixed rule or guideline for it.
*If you have any queries on the signal template, feel free to drop us a message.
Signal's Interpretation:
BUY Signal:-
*BT-Yellow-Diamond = Bottom reversal signal.
*Green-Upward-Triangle = Potentially a Bottom signal.
*Blue-Candle = Market at Uptrend sentiment.
*Candle color changed from RED to BLUE & Candle stand above the lifeline (Redline).
SELL Signal:-
*Red-Dot = Potentially a Top signal.
*Yellow-Dot = Potentially a Top signal.
*Red-Candle = Market at Downtrend sentiment.
*Candle color changed from BLUE to RED.


MMAG-READY TO BUY ON DIP?MMAG macam dah nak cross macd,boleh sedia untuk buy apabila AO merah bertukar ke signal bar hijau yang ke 3
#kajian ini adalah untuk praktis ilmu AO sahaja

MMAG SEEM LIKELY TO REBOUND BACKSEE MONDAY (5/10/2020) CANDLE AND VOLUME FIRST FOR CONFIRMATION REVERSAL FROM DOWNTREND TO UPTREND.
SUPPORT 0.395
FIRST TP 0.475
SECOND TP 0.515
THIRD TP 0.560
FOURTH TP 0.745
FIFTH TP 1.16
SIXTH TP 1.80

MMAG: Will history repeat itself? MMAG key R to break is 0.525 but in order to break that, big volume is needed and its not observable now. Could it build up to break that key price and go up parabolically which repeats is extremer uptrend before?

MMAG - are we expecting rebound now?-It has been 7 consecutive days of lower lows for MMAG.
-Next support at 665.
-OBV at 200mil, the lowest since Sep 2019, indicating high selling pressure
-it all started with some market correction, profit taking and announcement by politician to form new government
-on positive notes, current PM already secure support from Sabah poll - so impact of politic instability will vanish soon
-MMAG in news highlight such as job with ECRL, e-wallet JV with Green Packet and takeover of Bestinet - these all positive news
-technically there is no sign of trend reversal just yet, it will remain bearish until further indications otherwise

MMAG: SHORT FOR THE MEAN TIME?MMAG, WILL IT GAP DOWN TO TOUCH 50% RETRACEMENT? THIS IS CRITICAL PHASE FOR MMAG CAUSE IF IT BREAK LOWER, IT SHOULD TOUCH THE PRICE @ 0.895.
TAYOR!

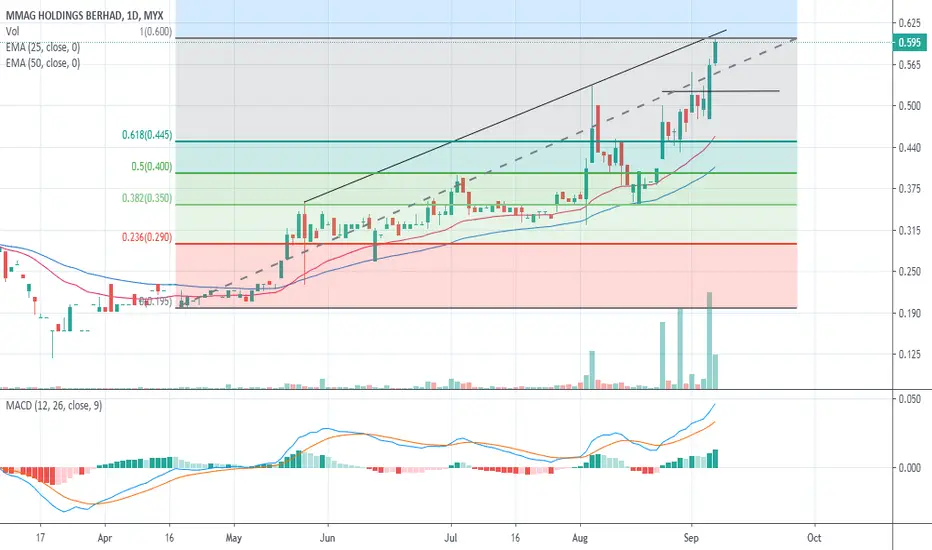
[14 September 2020] MMAG Holding Bhd Break Out Downtrend LineMYX:MMAG
Breakout Downtrend Line 52 Weeks High Line Fibbonaci Retracement Support & Resistant Zone

MMAG - going for next resistanceTechnically based on position of current price, 20MA, 50MA & 200MA, it looks good for further retest of next resistance at 0.37.
Furthermore slow stock just crossing up on Friday indicating daily trend reversal.

MMAG - MSREP : 320
CL : 305
S : 315
R1 : 340
R2 : 370
Number of Share: 929.07m
Sector : Technology
Sub-Sector : Digital Services

MMAG BO?Ep => 0.395
S = 0.360
CL = 0.350
TP= 0.450
TP=0.495
Monitor if stock can sustain above 0.395.
