MNHLDG CONTINUE MARKING UPThis is a continuation from my previous entry
**Refer link
Referring to the Red Box, I see it as a Stepping Stone (SS) , a mere temporary stop centre,
before continuing marking up from previous Trading Range (Red Arc Line).
My hypothesis is that, this box are forming a mini Trading Range , in which the formation of local spring , prompted me to initiate position.
The 3 Bars (Or Candlesticks, whatever you prefer), are basically a SpringBoard [/b ] in the form of Absorption.
For Non Wyckoffian, this might be confusing.
Different POV produce different meaning & context/subcontext.
I intiated my position @ 31/7/25, added position today
PureWyckoff
MNHLDG trade ideas

MNHLDG GOING TO CONT MARK UPI maintained my previous thesis for MNHLDG
**please refer to my previous
Just need an addition, for the formation of new 'Local Spring' *black color word
i was knocked out on last position for this
market environment dragged MNHDLG despite with a positive surrpise earning
Based on Spring Setup,
looks like Test Of The Spring success at the moment
i initaited position as attached with tight cut loss
PureWyckoff

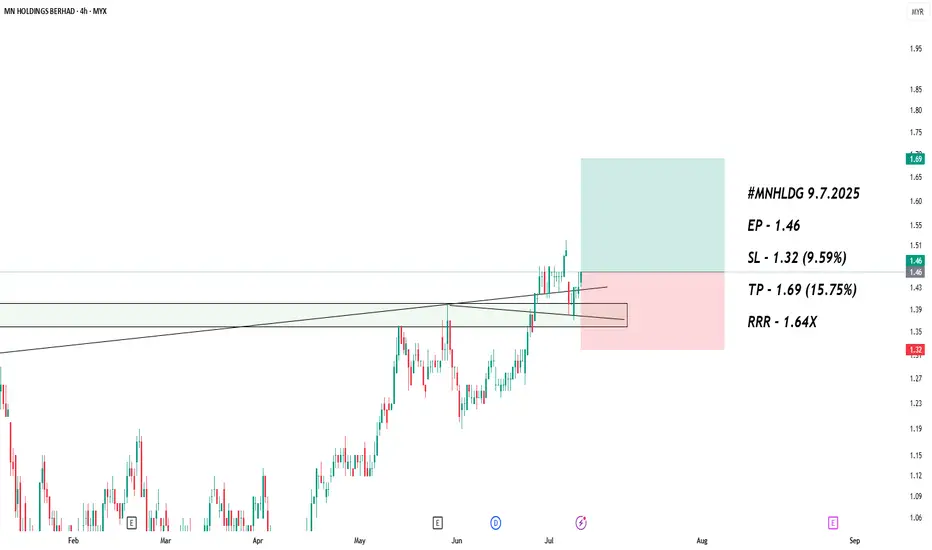
MNHLDG 4H Chart Analysis & Trading Plan SummaryBased on the 4-hour TradingView chart for MNHLDG, the stock is currently trading near RM1.30 and showing signs of attempting a retest towards its previous high near RM1.40. However, looking at the overall setup, we anticipate a possible short-term pullback before any potential breakout occurs.
Key Observations:
Trend & Structure: The stock has been trending upward with higher lows and is currently trading within a consolidation zone between RM1.25 and RM1.30. The horizontal resistance at RM1.30 has been tested multiple times, indicating seller presence at this zone.
Volume: Volume remains relatively flat with no significant surge, suggesting cautious accumulation rather than strong breakout momentum.
Indicators:
RSI is hovering just below the overbought region (~60), suggesting that while momentum is positive, a short breather may happen.
Stochastic Histogram shows a weakening bullish crossover and may begin to flatten or dip soon, supporting the pullback scenario.
Bollinger Bands are tightening slightly, implying upcoming volatility but not necessarily an immediate breakout.
Support Zones:
RM1.25 (minor support and previously tested level).
RM1.21 (more significant support — also in confluence with the mid-Bollinger line and prior swing low).
Resistance: RM1.30 (immediate), followed by RM1.40 (ATH).
Trading Plan:
Entry Zone (Accumulation Area):
RM1.25 to RM1.21 (look for bullish reversal candle or bounce confirmation).
Profit Target (TP):
TP1: RM1.30 (first resistance, quick trade opportunity).
TP2: RM1.40 (all-time high — strong resistance).
Stop Loss (SL):
Below RM1.18 (under previous swing low — invalidates the bullish structure).
Risk-Reward:
From RM1.22 entry, SL at RM1.18 and TP at RM1.40 offers a solid 4.5:1 reward-to-risk setup.
Summary:
MNHLDG shows a healthy uptrend with a potential for new highs, but current indicators suggest a temporary pullback could occur before the next leg up. A more ideal entry would be near RM1.22–1.25 support zone, riding the wave towards RM1.30 and possibly RM1.40. Be patient for a proper setup confirmation.
Disclaimer: This analysis is for educational purposes only and does not constitute a buy or sell recommendation. I am not affiliated with any brokers or advisory firms.

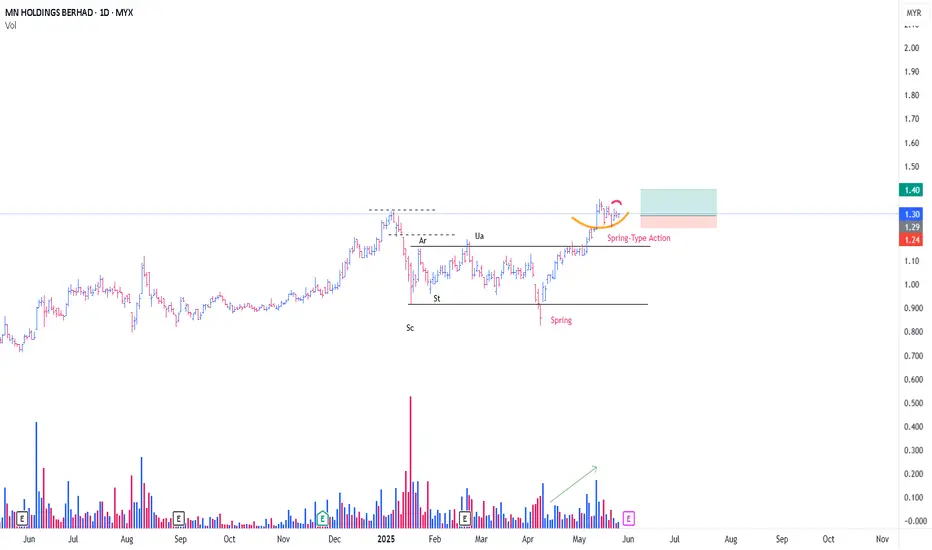
MNHLDG CONT TO MARK UPA rare schematic, of Type #1 Accmulation
This is a Power Play
-Since Spring, price soaring high with influx of demand (Green Arrow)
With a Possiblity of Feather's Weight ( Yellow LIne)
-Position initiated @ Spring Board (Red Line)
-Plus with additional Local Spring Type Action
Position intiated as attached
Tight Risk
PURE WYCKOFF


MNHLDG - Which sentiment is stronger, Bullish or Bearish?The chart presents two potential outcomes depending on the current market sentiment. The candle is below the Kumo, suggesting bearish momentum, but both bullish and bearish scenarios are possible:
N wave with E, V, N & NT projection.
The price is below the Kumo, indicating a bearish trend. However, a break above the NT level and Kumo could trigger a bullish shift.
The Chikou-Span is below the price action, which confirms the bearish trend, but a breakout above the Kumo would reverse this sentiment.
A buy signal could be confirmed with a close above 0.935 (NT level) and ideally above the Kumo.
Watch for a Kumo breakout to validate this bullish outlook. Failing to break above NT could invalidate the bullish scenario.
Wait for a breakout above the Kumo and NT (0.935) to confirm a bullish move towards 1.02, 1.05, and 1.10.
Y wave, target (E) within stipulated range.
The corrective Y wave formation is seen with the potential to continue downwards if the price fails to break above the NT level and remains under the Kumo.
The price is below the Kumo, and the Chikou-Span is also confirming bearish sentiment. If the price stays below NT (0.935) and continues its downward path, the bearish outlook strengthens.
If the price rebounds at (E) in the bearish scenario (Y wave), it could signal the end of the corrective phase and the potential for a new bullish wave to begin. Here's how you can approach the situation:
E (0.820 - 0.835): This zone represents the final target of the bearish Y wave. If the price reaches this level and shows signs of support or bullish reversal patterns (e.g., bullish engulfing, hammer), it could signal the beginning of a bullish recovery.
Look for candlestick patterns like a bullish engulfing or a hammer around the E (0.820 - 0.835) level.
If the price moves above the Kumo after a rebound from E, it will further confirm the bullish reversal.
A cross of the Tenkan-Sen over the Kijun-Sen below the Kumo could signal early bullish momentum.
After the rebound, the price could start a new N wave pattern with an upward trend.
New projections for N, V, and E targets can be calculated based on the rebound.
If a strong rebound is confirmed near 0.820 to 0.835 with bullish price action and Ichimoku alignment, consider entering a long position.
Place a stop-loss slightly below the E level (0.820) to minimize downside risk.
First target: Near previous resistance levels, likely around 0.94 (NT level).
Subsequent targets: 1.02 (N), 1.05 (V), and 1.10 (E) from the potential new N wave.
This would offer a good risk-to-reward setup, assuming the price respects the E level and bullish momentum follows.
Note:
1. Analysis for education purposes only.
2. Trade at your own risk.

MNHLDG swing tradeMultiple edge trading area as per screenshot
Buy on price increase and volume increase previous 2 trading days candle

MNHLDG, SETUP 1 HOURbuy: 20/10/23
capital RM13899
TP 30%: RM4169.7 -> RM18068.7
SL 6%: -RM833.94 -> RM13065.06
