NAIM MARKING UPA typical Re-Accmulation Schematic #2 pattern
With latest price action showing impending BO of BUEC
As demand going in (Red Arrow), i iniatiated position as attached today
Pure Wyckoff
NAIM trade ideas

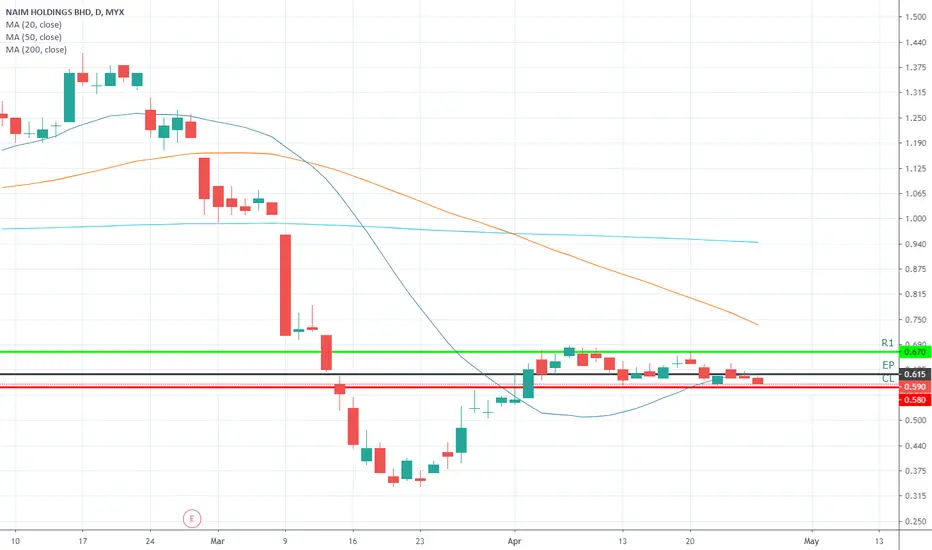
NAIM: Breakout Filter Combo With Tweezer Top and Bottom1. The Tweezer Top (7th July) is a bearish reversal pattern that consists of two candlesticks with identical or nearly identical highs. The pattern is typically found during uptrend and signals a potential trend reversal. The next following days the price went down.
2. The Tweezer Bottom (4th Aug) is a bullish reversal pattern. The pattern is typically found during a downtrend and signals a potential trend reversal.
3. The bullish candlestick at M15 filter3 appeared. It closed at 0.69 (the strongest resistance, rereferring to Gann Chart). If breaks, it will be potentially creating new HIGH.
4. The presence of the Tweezer Bottom pattern can serve as an additional confirmation for potential bullish price breakouts detected by the Breakout Filter.
5. TAYOR

NAIM: BASIC SWAP ZONE#NAIM (CASE STUDY)
Basic swap zone
Demand area 0.505-0.52.
TP1 0.57-0.585.
Risk: overall Downtrend, poor Q3 result
Lets monitor closely!
*Personal opinion trade at your own risk*


Naim Holdings - Trade ideas 15-19/2/21Trade ideas for this counter.
Pattern - bullish continuation flag
Price reject at buy zone area-green box.
Happy Trading
Tayor.

NAIM (5073) Property - Main MarketUndergoing 2nd cycle.
TP: 1.30
Cut loss: close below 0.640
Price now: 0.860 (23 Oct 2020)
Short term trend MA 25.


EASY123 Prediction @MYX NAIMPrediction: Price pullback after rally & landed at strong support (Redline)
Target Price: R1=0.99-1.03, R2=1.18-1.22, R3=1.38-1.44
Support/Cut Loss: S1=0.805-0.795, S2=0.69-0.68
*Trend direction: UPTREND - Price correction above our Lifeline (Redline) strong support 0.80
*Bottom reversal (Green-upward-triangle) signed on 27-Jul & (Yellow-diamond BT) on 29-Jul.
*Turning points (White-candle) have appeared on 30-Jul, an indication of the price revert to upward direction.
*Preference Strategy: Swing trading (Follow the BUY/SELL Signal respectively).
*Reminder TP & CL is an individual preference & decision. No fixed rule or guideline for it...Trade at your own risk.
*If you are interested in our trading template. Feel free to drop us a message, we are happy to share with you.
Signal's Interpretation:
BUY Signal:-
*Green-Background = Uptrend
*BT-Yellow-Diamond = Bottom signal.
*Green-Upward-Triangle = Potentially a Bottom signal.
*White-Diamond = Strong upward momentum accelerator.
*White-Candle = Turning point or a trend reversal.
*Yellow-Candle + Alert-Bell = Potential Price take-off area.
SELL Signal:-
*Red-Background = Downtrend.
*Red-Dot = Potentially a Top signal.
*Blue-Candle = Potential price selling off area.


<TradeVSA> Daily Stock Review & Update - 22 March 20201. Public Bank
2. Maybank
3. CIMB
4. RCE Cap
5. Paramount
6. MI Technovation
7. Naim
Hit the "LIKE" button to support us :)
Disclaimer
This information only serves as reference information and does not constitute a buy or sell call. Conduct your own research and assessment before deciding to buy or sell any stock

16 Feb 2020 Saham kajian minggu ini: NAIM oleh Sharina Yusop16 Feb 2020
Saham kajian minggu ini:
NAIM oleh Sharina Yusop
Aliran menaik
Patuh syariah
Mempunyai FA yang baik
Teknik belian : Seperti mana diberi di dalam carta
Selamat berdagang

16 Feb 2020 Saham kajian minggu ini: NAIM oleh Sharina Yusop16 Feb 2020
Saham kajian minggu ini:
NAIM oleh Sharina Yusop
Aliran menaik
Patuh syariah
Mempunyai FA yang baik
Teknik belian : Seperti mana diberi di dalam carta
Selamat berdagang

Naim Neck line break outPrice break out a 8 months upwards triangle neckline, with potential to reach RM1.60


Kaunter Kajian NaimKajian berdasarkan TA dan FA
TA = Berada di atas garisan MA 200 (Support yg kukuh)
FA = Syarikat yg positif Profit
ROE dan PE mencukupi syarat
#Long Team Trade


<TradeVSA> Naim Reversing with Pullback PatternStrength in the chart:
1. Bullish signal
2. Testing the gap
3. Line Change with volume
Disclaimer
This information only serves as reference information and does not constitute a buy or sell call. Conduct your own research and assessment before deciding to buy or sell any stock

Short Term (Contra Trade) : Naim1) Market Outlook - Global Market (green), KLCI (green), WTI (green), Brent (green) ~ Friday (12/4) closing
2) Sector Index - Construction (red), Energy (red), FMBSCAP (green) - Friday (12/4) closing
3) Technical Analysis - Consolidation is almost over from the reducing volume, I am aiming for a bounce off resistance 1.12 for a shorter term trade
4) Fundamental Analysis - Strong fundamentals w/ 2 consecutive profiting quarters and bullish sectors (oil + construction), mid term trade is feasible with next quarterly report in end of May 2019
Entry - 1.12 (risk to reward : 3.36)
Exit - 1.255 (12% gain)
Stop Loss - 1.08 w/ high volume (-3.57% loss)
