Nestcon: Breakout Potential for 2025Nestcon is showing signs of strength with a primary target at RM0.710 – nothing is impossible if this momentum continues!
✨ Key Levels:
• Strong support: RM0.350 - RM0.355
• Short-term target: RM0.550
• Long-term target: RM0.710
If volume increases, this could pave the way for further upside. Ke
0.015 MYR
7.86 M MYR
838.13 M MYR
145.49 M
About NESTCON BERHAD
Sector
Industry
CEO
Jee Gin Lim
Website
Headquarters
Puchong
Founded
2020
ISIN
MYQ0235OO000
FIGI
BBG011C1LVH0
Nestcon Bhd. operates as an investment holding company. It is principally involved in construction services for building, civil engineering, infrastructure projects, and renewable energy solutions. It operates through the Building and Infrastructure, and Renewable Energy segments. The company was founded on March 10, 2020 and is headquartered in Puchong, Malaysia.
Related stocks

Nestcon: Targetting box area .Nestcon is expecting to move higher targetting 0.500-0.530 in thr short tetm.


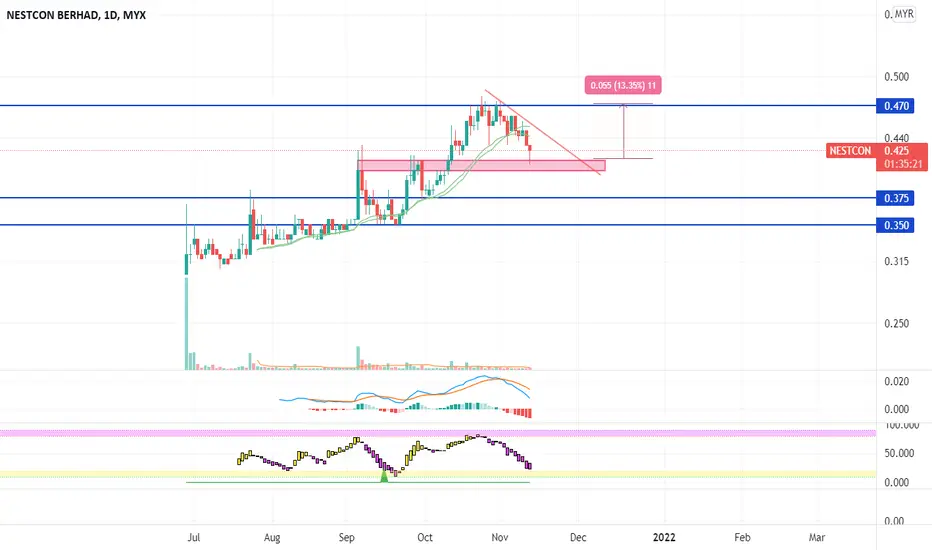
NESTCON - Trendline breakoutPrice has broken the trendline on 04/08/2022.
Would this indicates for NESTCON to change direction to uptrend?
Potential entry:
RM0.430 - RM0.435
Resistance:
RM0.465 / RM0.50
Support:
RM0.42
Disclaimer: This trading idea is for education purpose only. This is not a buy call nor a stock recomme

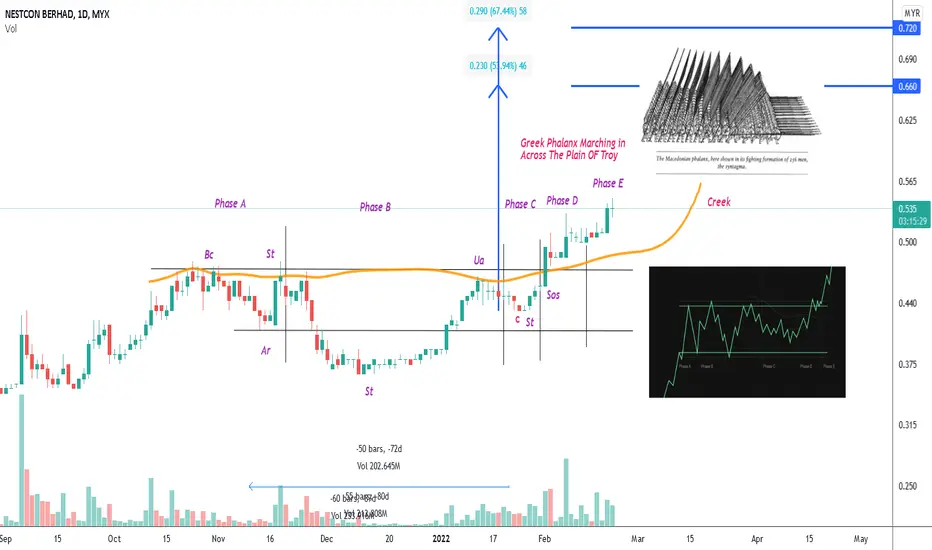
NESTCON MARKUP
phase E currently
Current price action simply levitate
halmark of absorption on the way up

VCP SETUP NESTCONNew listed company,makes all time high record.Price just breaks up from VCP setup.Looks attractive

NESTCONstill in selling pleasure
can wait at RBS
and monitor closely
might be the price will create new base/support
at that area
TAYOR
Nestcon reach new highNestcon is a good stock to watch. From the day this stock listing, nestcon is uptrend with HH HL as show in the chart. Today Nestcon reach a new high and with the current momentum for construction sector, i believe this stock will grow higher. My strategy with this stock is to wait this stock to pul

NESTCON - BO, CBR & RepeatFrom chart:
- Chart still new, not much left side history
- Keep seeing BO followed by CBR and continue to form HH formation
Trading Strategy:
- Try to buy at CBR zone or can straight play based on momentum.
- ROI: Secukup rasa atau secangkir ketamakan
Company Brief Background:
- New Constru

See all ideas
Summarizing what the indicators are suggesting.
Oscillators
Neutral
SellBuy
Strong sellStrong buy
Strong sellSellNeutralBuyStrong buy
Oscillators
Neutral
SellBuy
Strong sellStrong buy
Strong sellSellNeutralBuyStrong buy
Summary
Neutral
SellBuy
Strong sellStrong buy
Strong sellSellNeutralBuyStrong buy
Summary
Neutral
SellBuy
Strong sellStrong buy
Strong sellSellNeutralBuyStrong buy
Summary
Neutral
SellBuy
Strong sellStrong buy
Strong sellSellNeutralBuyStrong buy
Moving Averages
Neutral
SellBuy
Strong sellStrong buy
Strong sellSellNeutralBuyStrong buy
Moving Averages
Neutral
SellBuy
Strong sellStrong buy
Strong sellSellNeutralBuyStrong buy
Displays a symbol's price movements over previous years to identify recurring trends.
Frequently Asked Questions
The current price of NESTCON is 0.340 MYR — it hasn't changed in the past 24 hours. Watch NESTCON BERHAD stock price performance more closely on the chart.
Depending on the exchange, the stock ticker may vary. For instance, on MYX exchange NESTCON BERHAD stocks are traded under the ticker NESTCON.
NESTCON stock has risen by 4.62% compared to the previous week, the month change is a −4.23% fall, over the last year NESTCON BERHAD has showed a −20.93% decrease.
NESTCON reached its all-time high on Mar 1, 2022 with the price of 0.600 MYR, and its all-time low was 0.300 MYR and was reached on Jun 29, 2021. View more price dynamics on NESTCON chart.
See other stocks reaching their highest and lowest prices.
See other stocks reaching their highest and lowest prices.
NESTCON stock is 1.49% volatile and has beta coefficient of 0.65. Track NESTCON BERHAD stock price on the chart and check out the list of the most volatile stocks — is NESTCON BERHAD there?
Today NESTCON BERHAD has the market capitalization of 243.00 M, it has decreased by −2.86% over the last week.
Yes, you can track NESTCON BERHAD financials in yearly and quarterly reports right on TradingView.
NESTCON net income for the last quarter is 2.74 M MYR, while the quarter before that showed 3.09 M MYR of net income which accounts for −11.41% change. Track more NESTCON BERHAD financial stats to get the full picture.
No, NESTCON doesn't pay any dividends to its shareholders. But don't worry, we've prepared a list of high-dividend stocks for you.
As of Jul 26, 2025, the company has 1.03 K employees. See our rating of the largest employees — is NESTCON BERHAD on this list?
EBITDA measures a company's operating performance, its growth signifies an improvement in the efficiency of a company. NESTCON BERHAD EBITDA is 40.30 M MYR, and current EBITDA margin is 4.76%. See more stats in NESTCON BERHAD financial statements.
Like other stocks, NESTCON shares are traded on stock exchanges, e.g. Nasdaq, Nyse, Euronext, and the easiest way to buy them is through an online stock broker. To do this, you need to open an account and follow a broker's procedures, then start trading. You can trade NESTCON BERHAD stock right from TradingView charts — choose your broker and connect to your account.
Investing in stocks requires a comprehensive research: you should carefully study all the available data, e.g. company's financials, related news, and its technical analysis. So NESTCON BERHAD technincal analysis shows the sell today, and its 1 week rating is strong sell. Since market conditions are prone to changes, it's worth looking a bit further into the future — according to the 1 month rating NESTCON BERHAD stock shows the sell signal. See more of NESTCON BERHAD technicals for a more comprehensive analysis.
If you're still not sure, try looking for inspiration in our curated watchlists.
If you're still not sure, try looking for inspiration in our curated watchlists.