OCK trade ideas
OCK - Completing Rounding Bottom FormationOCK
Trend: Semi bullish
Rst: 0.65/ 0.68
Spp: 0.615
Green candle emerged from channel breakout zone at 0.615 and testing to complete its rounding bottom formation. As BB is pushing wider and volume is strong, more upside can be expected. But do note, this counter suggest to trade with smaller capital as the swing is pretty wild.
The Double Bottom Formation?Hi, i'm just a beginner in the stock market. But I just want to share what i think about OCK chart pattern.
OCK has made an obvious pattern of a double bottom.
I think this double bottom is forming a new uptrend.
First, the price has already breakout the resistance and there has been a return move back to the resistance trend line.
The resistance should have been a new support,
However the price has already break that line, but is currently rising up again.
With increase volume, i think OCK can manage to form a higher target price and will continue to form an uptrend.
Disclaimer: This is not a buy or sell signal (Especially when it comes from me; a beginner hehe)
Thank you for reading, please correct me if i'm wrong
Happy trading,
Izwanaizil (izwanaizil.com)
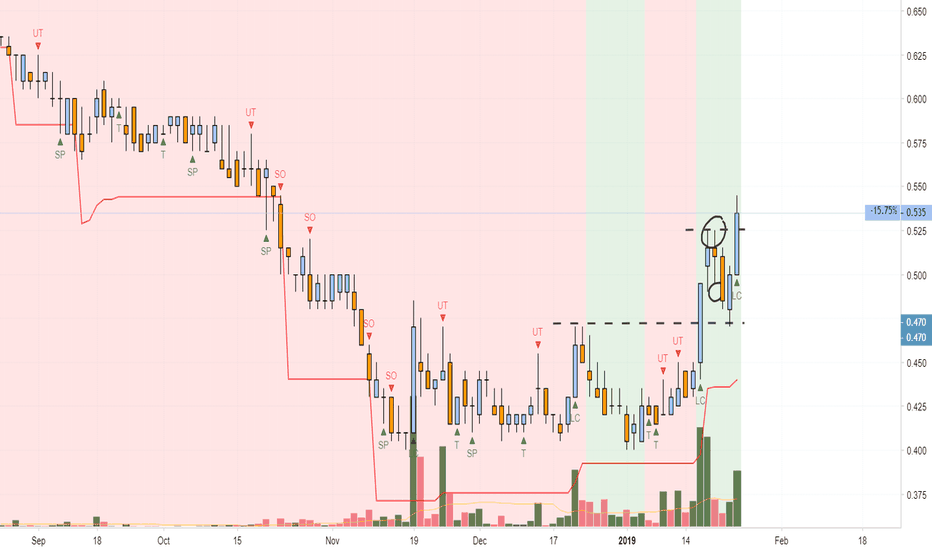
<TradeVSA> Pullback Completed by OCKStrength in the chart:
1. Support with Test & Spring bars
2. Pentagon with high volume
Disclaimer
This information only serves as reference information and does not constitute a buy or sell call. Conduct your own research and assessment before deciding to buy or sell any stock
<TradeVSA> Analyzing Volume in hourly chart - OCK GroupStrength in the chart:
1. Spring bar at pullback
2. Line Change high volume
3. Pulling back to support with low volume and narrow bar
Disclaimer
This information only serves as reference information and does not constitute a buy or sell call. Conduct your own research and assessment before deciding to buy or sell any stock
<TradeVSA> Is OCK still got momentum?Strength in the chart:
1. Major support level
2. Spring at bottom
3. Pullback in downtrend
Send us your preference stock to review based on TradeVSA chart by comment at below.
Disclaimer
This information only serves as reference information and does not constitute a buy or sell call. Conduct your own research and assessment before deciding to buy or sell any stock
OCK Group - Successful Pullback?Strength in the background:
1. Narrow Spread bar low volume
2. Closed above 18LC bar. Formed new support
Send us your preference stock to review based on TradeVSA chart by comment at below.
Disclaimer
This information only serves as reference information and does not constitute a buy or sell call. Conduct your own research and assessment before deciding to buy or sell any stock
Update Stock Ideas - AirAsia X & OCK OCK with +7% now and AAX still holding at support level.
Send us your preference stock to review based on TradeVSA chart by comment at below.
Disclaimer
This information only serves as reference information and does not constitute a buy or sell call. Conduct your own research and assessment before deciding to buy or sell any stock


