PAAlgo TradingSystem by Remisier CheDin
The current market conditions, as identified by my algorithmic system, indicate potential upward signals. These signals include increased trading volume, an upward trend with prices above the EMA20 and EMA50. Consequently, the present conditions suggest a possi
0.025 MYR
45.73 M MYR
564.63 M MYR
930.85 M
About P.A. RESOURCES BHD
Sector
Industry
CEO
Kuan Kam Lau
Website
Headquarters
Kuala Selangor
Founded
2004
ISIN
MYL7225OO005
FIGI
BBG000NP5X00
P.A. Resources Bhd. is an investment holding company, which engages in the manufacture, fabrication, distribution, and sale of aluminum billets and aluminum extrusion products. It operates through the following segments: Extrusion and Fabrication, Aluminium Billets Casting and Tolling, Money Lending, Investment Holding, and Other. The Extrusion and Fabrication segment covers the aluminium profiles for a variety of applications, ranging from simple architectural needs to high precision electronics applications. The Aluminium Billets Casting and Tolling segment represents the standard aluminium billet for general or miscellaneous use where moderate bending and forming is permissible. The Money Lending segment provides funding needs to the individual customers who purchase solar power generation devices from solar segment. The Other segment refers to non-core business activities of the Group. The company was founded on September 1, 2014 and is headquartered in Kuala Selangor, Malaysia.
Related stocks

MY: PA Resources Analysis 17.5.24Has break Resistance. Fibo TP at 0.48.
Manage to entry at 0.39. Personally, Will have short TP at 0.43.

PA, AlgoSignal reveals potential uptrendSeveral indicators within my algorithmic system are signaling a potential uptrend. These include:
- Increased volume: Activity is picking up, suggesting growing interest and potential momentum.
- Mid- to long-term uptrend: Both the 50-day and 150-day exponential moving averages are pointing upward,

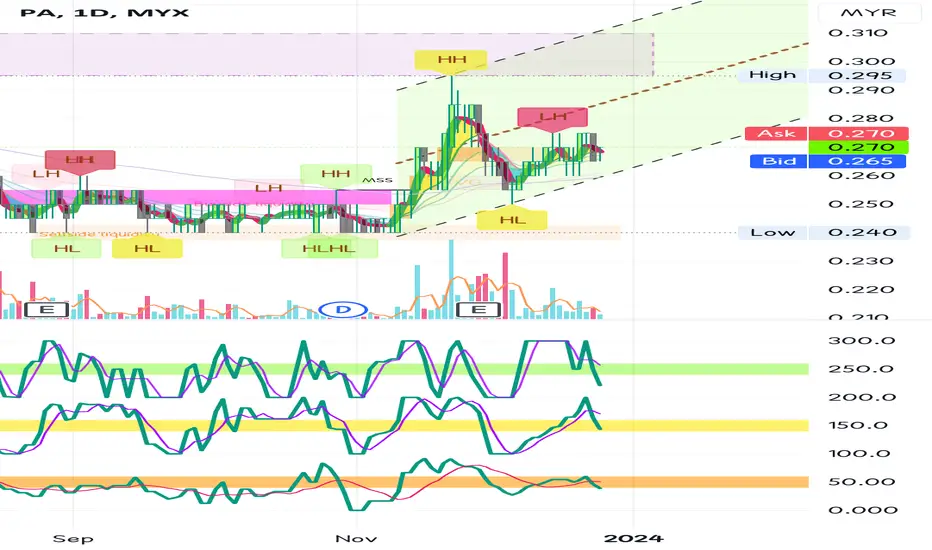
PA was triggered based on the MRV1 on 20 Dec 2023The PA buy signal was triggered based on the MRV1 setup at RM0.275. The target is a 20% increase to RM0.330, with a stop loss of RM0.245. This is expected to take 2–3 months due to the signal being based on the daily timeframe.
Not muuch can be said on its movement but I like how it presents itself

PA Resources, how it would be?22/11 touch FVG area and pullback.
Currently price at lower part of Parallel Channel, need to be careful as it may breakdown.
>> Price below Hull MA, personally will avoid ATM.
>> DC for Stochastics and RSI... Buy dip? Think twice though.
>> Possible to up? Maybe.. but might slow. I prefer fast mov
BREAK UPPER TRENDLINE PAFundamental,lost on last QOQ,but improve on YOY.Price has been broke the upper trendline.However need to past a latest horizontal line before it can fly
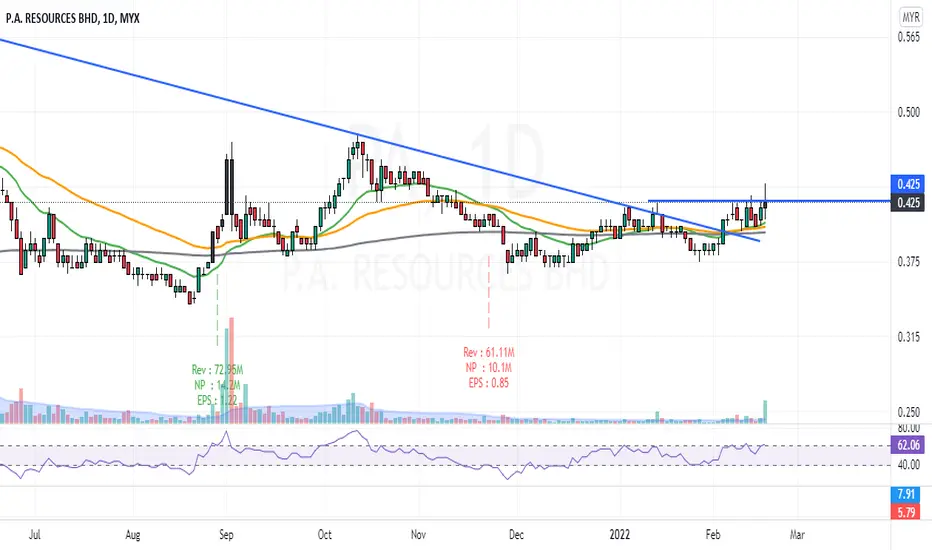
BREAK UPPER TRENDLINE PAQuite a stable company.Institutional favourite also.Price has break the uppertrendline,but not with significant amount yet.

P.A. Resources BhdGOODLUCK TRADERS
TRADE AT YOUR OWN RISK
buy at the support,sell at the resistance will be recommended!!!
“Compound interest is the eighth wonder of the world. He who understands it, earns it. He who doesn’t, pays it.” — Albert Einstein
JUST MY OPINION!
NOT A FINANCIAL ADVISE!!

PAFrom my view PA has not yet given any reversal pattern.
For comfirmation price must BO from the channel line and closed above 0.415.
#TAYOR MYX:PA

PA - True tester Down Trendline?Trendband cycle build up but no breakout candle for today. Now pullback to test Down Trendline. See how next candle react. EP above 0.475 would be good but look at pullback for EP also a smart move. Look for reversal candlestick at pullback area/Support area.

See all ideas
Summarizing what the indicators are suggesting.
Oscillators
Neutral
SellBuy
Strong sellStrong buy
Strong sellSellNeutralBuyStrong buy
Oscillators
Neutral
SellBuy
Strong sellStrong buy
Strong sellSellNeutralBuyStrong buy
Summary
Neutral
SellBuy
Strong sellStrong buy
Strong sellSellNeutralBuyStrong buy
Summary
Neutral
SellBuy
Strong sellStrong buy
Strong sellSellNeutralBuyStrong buy
Summary
Neutral
SellBuy
Strong sellStrong buy
Strong sellSellNeutralBuyStrong buy
Moving Averages
Neutral
SellBuy
Strong sellStrong buy
Strong sellSellNeutralBuyStrong buy
Moving Averages
Neutral
SellBuy
Strong sellStrong buy
Strong sellSellNeutralBuyStrong buy
Displays a symbol's price movements over previous years to identify recurring trends.
Frequently Asked Questions
The current price of PA is 0.175 MYR — it hasn't changed in the past 24 hours. Watch P.A. RESOURCES BHD stock price performance more closely on the chart.
Depending on the exchange, the stock ticker may vary. For instance, on MYX exchange P.A. RESOURCES BHD stocks are traded under the ticker PA.
PA stock hasn't changed in a week, the month change is a −2.78% fall, over the last year P.A. RESOURCES BHD has showed a −52.05% decrease.
PA stock is 2.94% volatile and has beta coefficient of 1.16. Track P.A. RESOURCES BHD stock price on the chart and check out the list of the most volatile stocks — is P.A. RESOURCES BHD there?
Today P.A. RESOURCES BHD has the market capitalization of 263.33 M, it has decreased by −5.56% over the last week.
Yes, you can track P.A. RESOURCES BHD financials in yearly and quarterly reports right on TradingView.
PA net income for the last quarter is 7.40 M MYR, while the quarter before that showed 10.06 M MYR of net income which accounts for −26.46% change. Track more P.A. RESOURCES BHD financial stats to get the full picture.
P.A. RESOURCES BHD dividend yield was 2.63% in 2024, and payout ratio reached 32.68%. The year before the numbers were 3.92% and 45.66% correspondingly. See high-dividend stocks and find more opportunities for your portfolio.
EBITDA measures a company's operating performance, its growth signifies an improvement in the efficiency of a company. P.A. RESOURCES BHD EBITDA is 52.13 M MYR, and current EBITDA margin is 12.36%. See more stats in P.A. RESOURCES BHD financial statements.
Like other stocks, PA shares are traded on stock exchanges, e.g. Nasdaq, Nyse, Euronext, and the easiest way to buy them is through an online stock broker. To do this, you need to open an account and follow a broker's procedures, then start trading. You can trade P.A. RESOURCES BHD stock right from TradingView charts — choose your broker and connect to your account.
Investing in stocks requires a comprehensive research: you should carefully study all the available data, e.g. company's financials, related news, and its technical analysis. So P.A. RESOURCES BHD technincal analysis shows the neutral today, and its 1 week rating is sell. Since market conditions are prone to changes, it's worth looking a bit further into the future — according to the 1 month rating P.A. RESOURCES BHD stock shows the sell signal. See more of P.A. RESOURCES BHD technicals for a more comprehensive analysis.
If you're still not sure, try looking for inspiration in our curated watchlists.
If you're still not sure, try looking for inspiration in our curated watchlists.