<TradeVSA> The GAME is OVER for Pasukhas ?Sign of Weakness in the chart:
1. Climatic Volume on Upbar
2. Huge Distribution with Up-Thrust and Sell-Off
3. Confirmation on Weakness in Hourly Chart
Case Study:
1. Asdion
2. Macpie
3. MMAG
Disclaimer
This information only serves as reference information and does not constitute a buy or sell call. Conduct your own research and assessment before deciding to buy or sell any stock
PASUKGB trade ideas

Ascending Channel PASUKGBTechnically in 30m TF show price action in Ascending Channel.
Within an ascending channel, price does not always remain entirely contained within the pattern’s parallel lines but instead shows areas of support and resistance that can use to set stop-loss orders and profit targets.
If price closed breakout above an ascending channel can signal a continuation of the move higher, while a price closed breakdown below an ascending channel can indicate a possible trend change.
Ascending channels show a clearly defined uptrend. Can swing trade between the pattern’s support and resistance levels or trade in the direction of a breakout or breakdown.
Can use EMA50 & EMA10 as supprt too.
#Swing
#TAYOR MYX:PASUKGB

Trends of PASUKGB** No buy/sell call **
** Solely for education purpose only **
1. looking the trends which moving above MA20 and upper band of MACD which is good signed and having some strength of pricing movement
2. however, the volume is getting lesser but price is increasing. this causing the gap in between get bigger and bigger
3. the next resistance will be @ 0.465, if it touch but not break through then it may be retracement happen

PASUKGBPP has been completed at cost of 0.062.
Current price ranging from 0.07-0.075
R1: 0.0.9
R2: 0.125
Just an idea not a buy call. For education purpose.

PRIVATE PLACEMENT AND ESOS COMING (FLYYYYY)I show you
Support
Resistance
Trendline
EMA
MACD
RSI
Fibonacci Retracement
Gann Square of Nine

23/9/2020 PASUKGB - Testing strong support1. Gap up on 1st Sep followed by higher price with high volume on the next day made the 0.08-0.085 area a strong support.
2. Coincidentally, daily EMA50 line is also now at 0.085 area make it one of highly congested area.
Scenario 1 : The price will testing support before bounce back (BULLISH)
Scenario 2 : The daily candle will fill the gap between 0.08 and 0.085 tomorrow before continue climbing up the next day (BULLISH)
Scenario 3 : If the price continue goes down and break support with high volume, the bearish pattern will continue (BEARISH)
Scenario 4 : If gap down occur tomorrow 24/9/2020 and price open 0.08 or below and daily candle closed below 0.08, island reversal pattern will be formed and price will continue go down. (BEARISH)
EP 0.085
TP 0.105
CL 0.075
This is a trading idea and not a buy call.

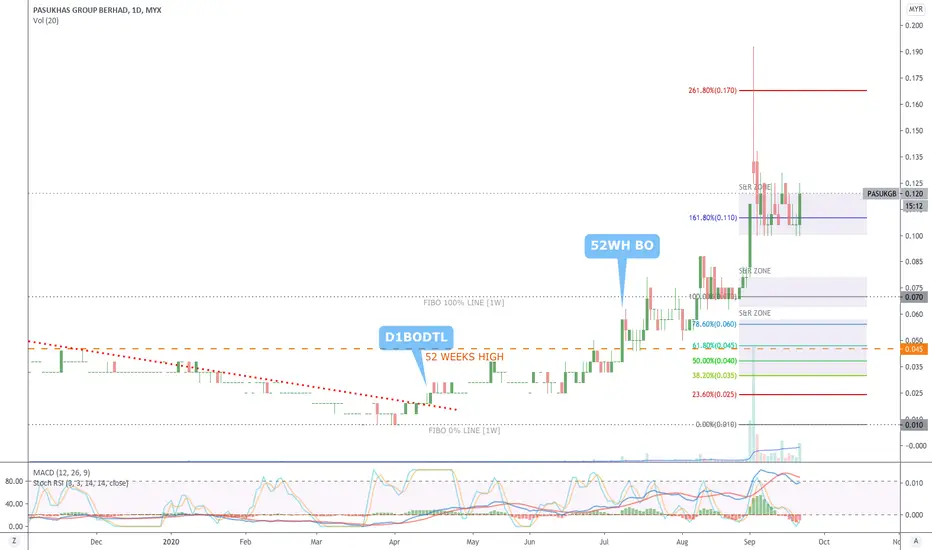
PASUKGB [22 September 2020] Strategy: Buy On Resistant Zone BreaMYX:PASUKGB
Breakout Downtrend Line
52 Weeks High Line
Fibbonaci Retracement
Candlestick Support & Resistant Zone
Trendline Support & Resistant
PASUKGB saja bagi trader lain panic ke ?Penemuan pattern harmonic didalam, menunjukkan price masih boleh kearah atas sebelum membuat reversal kebawah.
Mungkin kepada yang dah hold boleh consider untuk TP kat bawah level fibo hijau diatas.
Manakala yang belum hold mungkin boleh consider untuk sauk kat level biru dibawah bila harga dah buat reversal.
Tapi kena ingat, ini study of probability at the current price, kita takkan tahu apa boleh terjadi dlm market at anytime.
Apapun kena sentiasa ingat untuk cut loss.
Tayor....

PASUKGB MSR
EP : 0.065
CL : 0.055
S : 0.060
R1 : 0.070
R2 : 0.080
PENNY Counter
Market Capital (RM) : 52.94m
