PENSONI IN HARMONIC PATTERNConsider to study and monitor Pensoni's current daily chart which resembles that of a Bullish Butterfly Harmonic Pattern where the price above Point D is deemed as the Potential Reversal Zone. The probable EP is 0.600 which is the pivot point, the probable minimum TP is 0.730, which is below Point
−0.025 MYR
−3.59 M MYR
334.12 M MYR
About PENSONIC HOLDINGS BHD
Sector
Industry
CEO
Chuon Jin Chew
Website
Headquarters
Simpang Ampat
Founded
1965
ISIN
MYL9997OO007
FIGI
BBG000FT9FL3
Pensonic Holdings Bhd. is an investment holding company. It operates through the following segments: Manufacturing, Trading, and Others. The Manufacturing segment focuses on assembling and selling electrical and electronic appliances. The Trading segment includes selling and distributing products. The Others segment is involved in investment holding and providing management services. The company was founded by Weng Khak Chew in 1965 and is headquartered in Simpang Ampat, Malaysia.
Related stocks

A Rebound From Support Line!Using Fibonacci as a guideline, the price already rebounds from the lowest level price. Hence, it is in Reversal Pattern. OBV chart showing a Divergence signal but the MACD chart is still in a negative signal. Put in your WL and watch out for significant price movement.
R 0.720
S 0.680

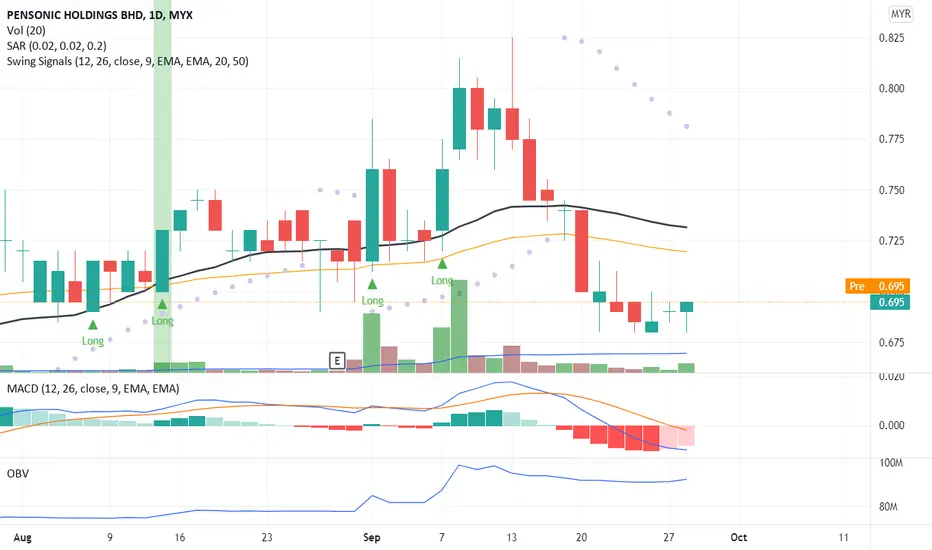
In A Sideway Pattern!PENSONIC chart is in a Sideway Pattern when the price is within a fairly stable range without forming any distinct trends over some period of time. OBV chart shows positive momentum. But MACD is still in negative momentum. Put in your WL and watch out for a significant price movement to form a Break
PENSONI VCP SETUPOverall VCP for PENSONI is crispy. The contraction and volume relationship looks promising.
C1: -28%
C2: -8%
C3: -7%
C4: -6%
C5: -5%
Recent September volume enter breakout the previous pivot.
Will it continue to attack higher? Let's see!
Disclaimer:
Not a buy call suggestion, just my sharing o

Is It a Confirmation Downtrend?At T6, the price has been pushed down below MA20. Is It a Confirmation Downtrend? MACD and OBV charts confirm the trend. Will it be able to bounce back?
R 0.830
S 0.740

Is it a Divergence Trend?At T5, there was a significant price push down the price to 0.75. Where less demand, people are looking to buy. Is it a Divergence Trend? MACD and OBV charts confirm there is a change of pattern to downtrend. If today trade, the price close below MA20 then it confirms a downtrend pattern.
R 0.830

Buy on Dip at T4!Recently trade the price at a higher level at 0.825 be it been pushed back and closed at 0.775. It shows PENSONIC still has a buying interest from the traders. PENSONIC is still in an Uptrend pattern which confirms from MACD and OBV chart.
R 0.830
S 0.740

Positive Outlook on T3!PENSONIC bounces back and resumes the Uptrend pattern at T3 with a small volume confirmed the price which is below Volume MA20. PENSONIC is still in an Uptrend pattern which confirms from MACD and OBV chart.
R 0.830
S 0.740

Downward Pullback on T2!It is common for a stock to have Downward Pullback or Retracement from recent peaks that occur within a continuing uptrend. Congrats to traders who entering at T0 and make a profit at T1 or T2.
In PENSONIC scenario, the Pullback or Retracement is without high pricing drops and large volume. PENSONI

Is PENSONIC Able to Keep Up the Momentum in T2?T0 showing an Engulfing Candle. An indicator showing buyers push the price high. At T1, the buyer takes the position and closes the price higher a large volume compared with T0. Is PENSONIC Able to Keep Up the Momentum in T2?
R 0.830
S 0.740

See all ideas
Summarizing what the indicators are suggesting.
Oscillators
Neutral
SellBuy
Strong sellStrong buy
Strong sellSellNeutralBuyStrong buy
Oscillators
Neutral
SellBuy
Strong sellStrong buy
Strong sellSellNeutralBuyStrong buy
Summary
Neutral
SellBuy
Strong sellStrong buy
Strong sellSellNeutralBuyStrong buy
Summary
Neutral
SellBuy
Strong sellStrong buy
Strong sellSellNeutralBuyStrong buy
Summary
Neutral
SellBuy
Strong sellStrong buy
Strong sellSellNeutralBuyStrong buy
Moving Averages
Neutral
SellBuy
Strong sellStrong buy
Strong sellSellNeutralBuyStrong buy
Moving Averages
Neutral
SellBuy
Strong sellStrong buy
Strong sellSellNeutralBuyStrong buy
Displays a symbol's price movements over previous years to identify recurring trends.
Frequently Asked Questions
The current price of PENSONI is 0.390 MYR — it has increased by 9.86% in the past 24 hours. Watch PENSONIC HOLDINGS BHD stock price performance more closely on the chart.
Depending on the exchange, the stock ticker may vary. For instance, on MYX exchange PENSONIC HOLDINGS BHD stocks are traded under the ticker PENSONI.
PENSONI stock has risen by 2.63% compared to the previous week, the last month showed zero change in price, over the last year PENSONIC HOLDINGS BHD has showed a −30.36% decrease.
PENSONI reached its all-time high on May 6, 2021 with the price of 0.890 MYR, and its all-time low was 0.170 MYR and was reached on Apr 2, 2009. View more price dynamics on PENSONI chart.
See other stocks reaching their highest and lowest prices.
See other stocks reaching their highest and lowest prices.
PENSONI stock is 11.43% volatile and has beta coefficient of 0.00. Track PENSONIC HOLDINGS BHD stock price on the chart and check out the list of the most volatile stocks — is PENSONIC HOLDINGS BHD there?
Yes, you can track PENSONIC HOLDINGS BHD financials in yearly and quarterly reports right on TradingView.
PENSONI net income for the last quarter is −897.00 K MYR, while the quarter before that showed −168.00 K MYR of net income which accounts for −433.93% change. Track more PENSONIC HOLDINGS BHD financial stats to get the full picture.
EBITDA measures a company's operating performance, its growth signifies an improvement in the efficiency of a company. PENSONIC HOLDINGS BHD EBITDA is 5.89 M MYR, and current EBITDA margin is 1.98%. See more stats in PENSONIC HOLDINGS BHD financial statements.
Like other stocks, PENSONI shares are traded on stock exchanges, e.g. Nasdaq, Nyse, Euronext, and the easiest way to buy them is through an online stock broker. To do this, you need to open an account and follow a broker's procedures, then start trading. You can trade PENSONIC HOLDINGS BHD stock right from TradingView charts — choose your broker and connect to your account.
Investing in stocks requires a comprehensive research: you should carefully study all the available data, e.g. company's financials, related news, and its technical analysis. So PENSONIC HOLDINGS BHD technincal analysis shows the buy rating today, and its 1 week rating is sell. Since market conditions are prone to changes, it's worth looking a bit further into the future — according to the 1 month rating PENSONIC HOLDINGS BHD stock shows the sell signal. See more of PENSONIC HOLDINGS BHD technicals for a more comprehensive analysis.
If you're still not sure, try looking for inspiration in our curated watchlists.
If you're still not sure, try looking for inspiration in our curated watchlists.