Penta, near resistance?Once one of the hottest stocks during the bull run... but that’s history now. From its all-time high of 6.740, it's down nearly 65%.
Currently, the price is in the overbought zone and approaching a key resistance area. Despite the recent rebound, MACD remains below the zero line, suggesting the overall momentum still lacks strength.
Should we keep an eye on it? Maybe, but not for entry at this stage. If you're in profit, consider securing some. Better to wait for a healthy setup than chase a tired rally.
Disclaimer: This is not a buy or sell call. Just sharing for study and discussion purposes. Always do your own analysis before making any trading decisions.
PENTA trade ideas

Pentamaster, Is the downtrend getting weaker ?As you can see, Daily Chart is making chart pattern QM (Quasimodo). Buy at current price better because it is not high liquidity (hard to match price). With risk reward 1:3.


PENTA IS MORE POTENTIAL TO SHORT POSITIONKiller wave c is in progress.
Better take profit and wait for C wave complete.
Short position from 5.25 wave C ending point will be 1.20 to 1.00.
Brace your self.

Recovery for Malaysia Technology SectorWatch the video to see why 2023 will be a recovering tech stock for bursa Malaysia.
How to view the guidance via chart ( Refer back to pin message guidance if to trade )
Red Line = Support
Blue Line = Resistance
Light Blue = bullish/bearish pattern
Arrow = Double/Trip top/bottom
Red Chip = $$
Green Chip = XX

PENTA is coming back againMYX:PENTA
investor keep accumulate at lower price. Last 10 mins from RM3.490 direct buying at RM3.580

Weekly Fibonacci retracement + oversoldWeekly Fibonacci retracement + oversold. Buy zone 2.68-3.54 sen

PENTA TECHNICAL ANALYSISTechnical analysis for PENTA Stock based on Trend Analysis, Chart Pattern and Fibonacci Retracement

PENTAJust simple idea
in small time frame, try hard tp make HH
have to break previos HH and HL
for study purpose
but still can be in ur WL
find the best entry
potential 50-50
TAYOR

How to spot Divergence in chart.This is for educational purpose. I using hourly chart to spot divergence.
Trade at your own risk.
This is not a buy/sell call.


PENTA - Downtrend Decelerating & Potential Price BottomingNO INVESTMENT ADVICE IS PROVIDED
DISCLAIMER
Please consider your own interpretation of Opportunity & Risk. The author of this post strictly follows the Malaysian Security Commission ( SC ) Guidelines on the prohibition of Investment Advice by unlicensed parties. Any examples shall use historical charts without any recommendations and not to cause inducement to the public to take action or position (e.g. buy, sell or hold) regarding a particular class, sector, or instrument in relation to securities or derivatives. The author will never provide any investment or trading advice as the activity of giving investment advice is likely to be considered as a regulated activity under the Capital Markets and Services Act 2007 ( CMSA ). All posts made in Tradingview do not include any communications involving providing recommendations or opinions or includes any material, content or any statement which are likely to induce a person to take any action or position (e.g. buy, sell or hold) regarding a particular class, sector, or instrument in relation to securities or derivatives that is likely to be considered as “advising others concerning securities or derivatives”. The author will not recklessly make any statement, promise or forecast that is misleading, false or deceptive to induce or attempt to induce another person to deal in securities or derivatives. None of information posted in post can be used as investment decisions. Do not trade solely on the information posted. Trade at your own risk and judgement. A trader could potentially lose all money. Only risk capital that can be lost without jeopardizing ones financial security of lifestyle. Please seek licensed professional guidance if you plan to invest your capital seriously.

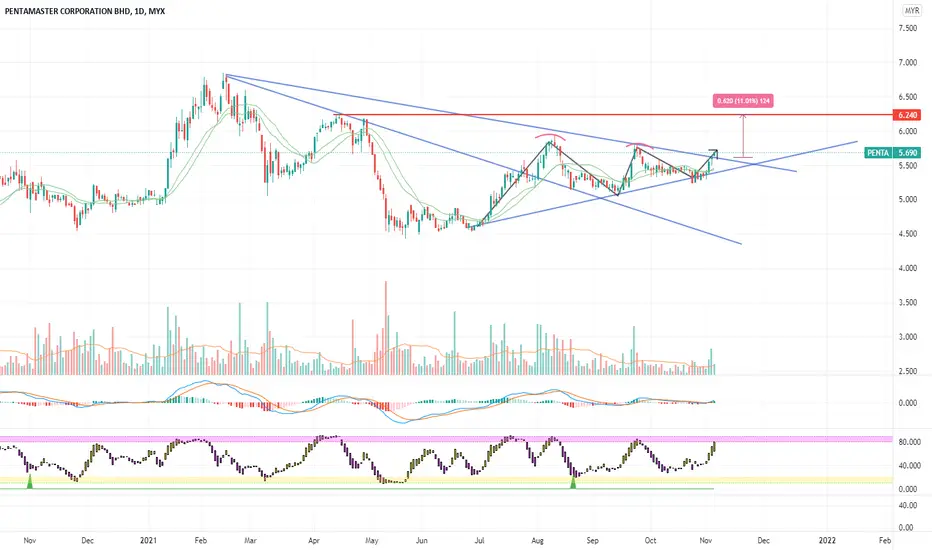
Possible breakout of the triangle?BUY
- under 6.00 with a stoploss when it breaks the lower trendline
- average up if it breaks 6.10 and 6.25 with increasing volume
SELL
- there are multiple resistance from the previous bull cycle since last year
- nail some profits if it can't break the resistance
RATIONALE
- the recent sell-downs were because of the possible hike rate and overvaluation of tech-related stocks
- possible entry was around 5.70 with a stoploss around 5.50
- came back down with a long red candle WITH shadow which might indicate interest in the stock still - need time to monitor the possible future trend
- if the trend is still intact, there might be a breakout of the triangle when QR is out soon
- FPE might bring the valuation down albeit the overpriced scenario across the tech/industrial board in KLSE
**the analysis is solely for my own references and learning

Time to buy the dip for Penta? Too good to ignore Pentamaster's trend chart. High chance that it will bounce back at the support level as indicated. Pentamaster has always been a good growth stock and long term play for this stock will give you guaranteed profit.

PENTA - Downtrend ?Candle start to test the short term EMA on the weekly candles, may go further down if it breaks key level of support at 5.65 . If resistance at 5.65 broke.
It is retracing from overbought region and weekly MACD about to form a dead cross with driving histogram towards negative territory and hence price is likely to head south.
Further supports at :
Support 5.4
Support 4.9
Support 4.5


PENTA VCP DevelopmentPenta is developing volatility contraction pattern for almost 3 months with contraction % below:
C1: ~18%
C2: ~8%
C3: ~5%
C4: ~4%
Breakout happened yesterday with strong volume.
Immediate support at RM4.90 with ~6% risk.
Disclaimer:
For technical analysis sharing purpose. Please seek advice from your financial planner if you would like to get any stock recommendation.


PENTAMASTER CORPORATION BHD (15-DECEMBER-2020)A bullish engulfing rebounded off 61.8% FR and Span B Kumo Cloud. The price is expected to resume its upward movement.
EP - 5.08
Next R/ TP:
• 5.21(coincides with 61.8% FE)
• 5.33(coincides with 78.6% FE
• 5.48 (coincides with 100% FE)
Support:
• 4.810 (61.8% retracement). Immediately cut loss below 4.805
