POHKONG trade ideas

Pohkong: 1.40?Pohkong is on an uptrend move. Based kn the current trend and snr, pohkong is expecting to reach 1.40 soon. The fundamantal of gold at peak price also will support the interest for the buyers.
Tayor!

PohKong's price and Gold's Price. 4/Dec/23Pohkong Price still inside a big triangle while Gold already breaking ATH. But both still in "ranging market" in next 2,3years.

POHKONG BULLISH WITH HIDDEN DIVERGENCEBismillahirrahmanirrahiim
What i can see there are hidden divergence was formed which is a bit rare to see this kind of divergence. Since there are gap upon. I believe the upside potential is high. Target for previous swing high might reward around R3

Cup and handle pattern if breakoutAnother perspective for POHKONG. Upside for this stock looks very good if breakout the handle.


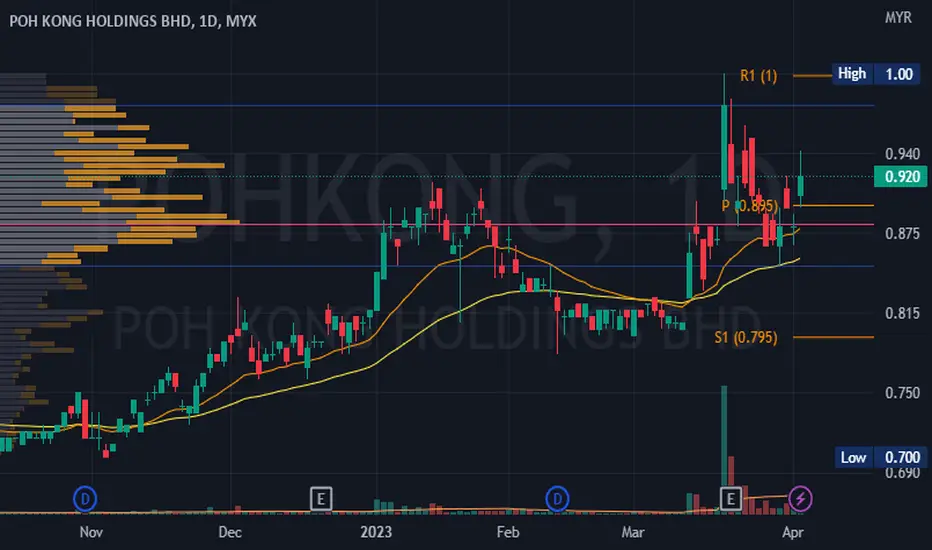
Trading above its 50-day moving average (MA)Looking at the chart of Poh Kong Holdings Berhad (MYX:POHKONG) and using the Moving Averages indicator, we can see that the stock has been trading above its 50-day moving average (MA) for most of the past few months. This indicates that the stock has been in an uptrend, and traders may want to consider buying on dips.
However, there have been some recent bearish signals, as the stock has fallen below its 20-day MA and the 20-day MA has crossed below the 50-day MA. This suggests that the short-term trend may be turning bearish, and traders may want to be cautious about buying at current levels.
In terms of potential support and resistance levels, there is some near-term support around the RM0.85 level, which was a previous resistance level that the stock broke through in early September. On the upside, there is potential resistance around the RM1.00 level, which was a previous high that the stock reached in late August.
Overall, traders may want to wait for more clarity on the stock's short-term trend before making any trades. If the stock can regain its upward momentum and break above the RM1.00 level, it could be a bullish sign. However, if the stock continues to trade below its 20-day and 50-day MAs, it could be a bearish signal.
Pohkong. Probably a deep pullback before surging up. 5/Jan/23Pohkong price have been surging up for > 30% for past 6 months due to gold price. As gold price might be in “consolidation” probably “triangle range” for few years. So will pohkong..

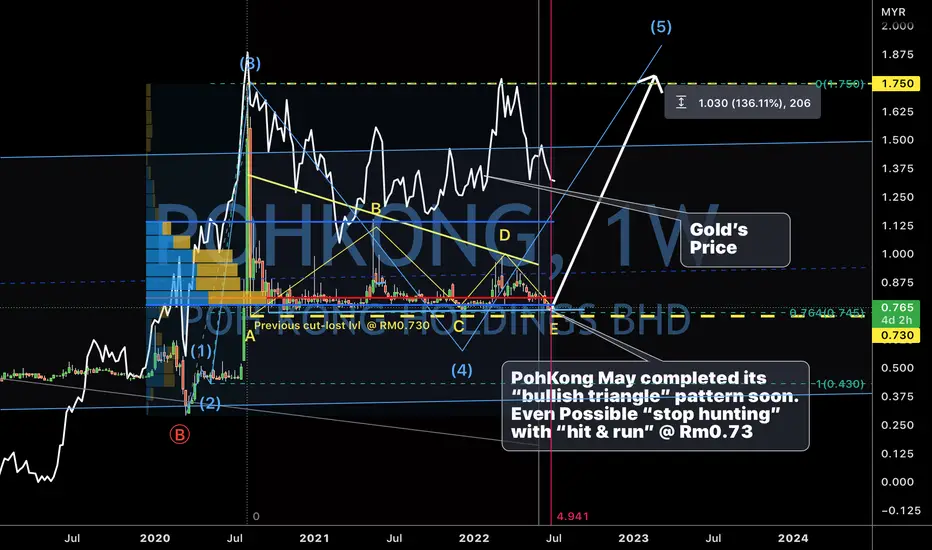
Pohkong and Gold’s correlation. 4/July/22PohKong May completed its “bullish triangle” pattern soon. Even Possible “stop hunting” with “hit & run” @ Rm0.73.
Pohkong “flying” with or without Gold? 11/May/22Gold as a main trading instrument for “hedging” inflation doesn’t seem its “shining” probably the The trump “cash is king/US $ “ “after affect” still “dominating” after 2 years..What “make up stories /fundamentals news“ “can buy” this time that could make gold soaring high again?!

Pohkong maybe “pullback” to Rm0.780 again. 13/April/22Missing a “boat” to ride gold with pohkong . ? Maybe @ Rm0.780 on wave (E) (cyan).for last ticket to the “moon”.?

POHKONG may just completed its bullish triangle. 16/Mar/221)On Charts : Charts consist of 3-Dimensions - The X-factor ( Time or Cycle ), The Y- factor ( Price Geometry ), AND The Z-factor ( The Speed ).. 2)On Elliot Wave / Market Structure : Unlike Textbook written rule : ALL Impulsive wave comprise of ONLY a-b-c sub-waves NOT 1,2,3,4,5 waves.. AND there is NO Truncated 5th wave BUT ONLY wrong wave counts...
Disclaimer

POHKONG. Risk/Reward Trade. 25/Feb/22POHKONG. Potential having more than > 5:1 "Very Good" reward-to-risk ratio trade setup, As current price of Rm0.865.. As Risk 13.29% VS 102.31%...

A Breakout Signal!The price candlestick indicates a breakout signal due to significant price movement with high volume above the MA20 line.
The RSI momentum towards indexes 70 where high buying momentum.
MACD and OBV indicators indicate a positive trend towards an uptrend pattern.
Precaution for a price correction ~10% - 20% from recent peak price due to short position by the traders.
Let's save POHKONG in WL and watch out for significant price movement with volume momentum supporting the price uptrend towards the next resistance.
R 1.110
S 0.815

FEBRUARY WEEK 3, POHKONGBest waiting for next impulse
weekly strong candle break ma 20/50
++ healthy volume

POHKONG and GOLD correlation chart. 13/Feb/22POHKONG's bullish triangle seem still valid.. perhaps..still waiting for GOLD price surging up to all time high again...
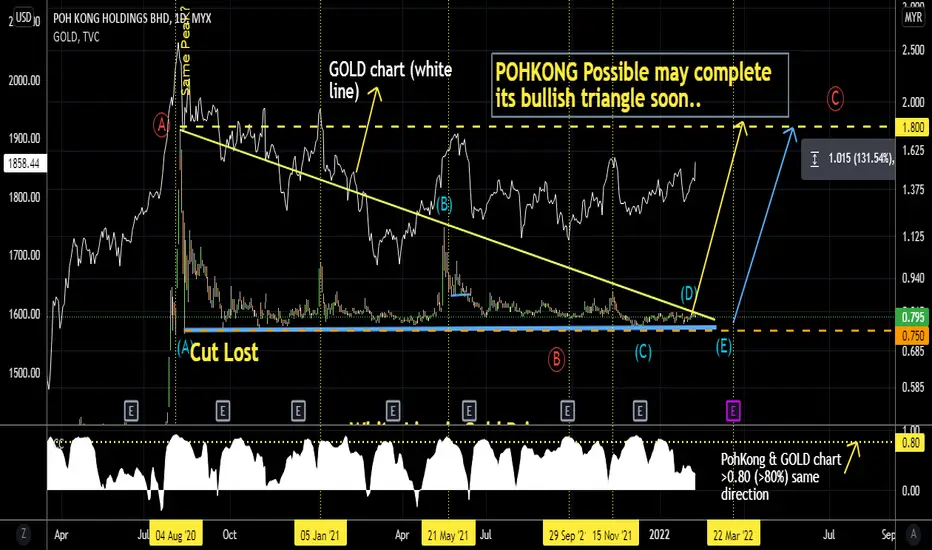
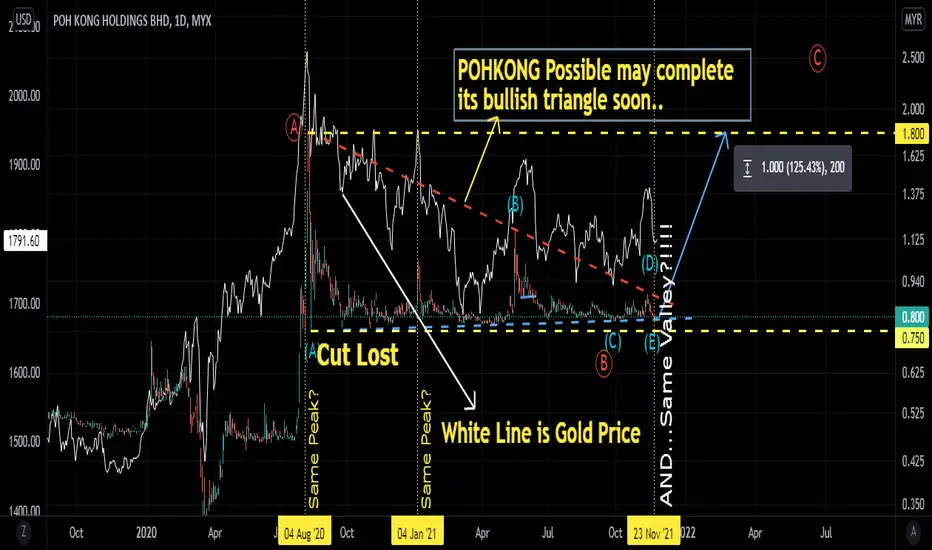
POHKONG and GOLD correlation chart. 27/Nov/21POHKONG chart seem like is going to completed its wave (E)( Cyan) of bullish Triangle soon. A potential of >125% Gain ( From RM0.80 to RM1.800 )...
POHKONG may done wave (D)(cyan) of triangle. 16/Nov/21POHKONG ( Gold/ Jewelry retailer ) may just completed its wave (D) (cyan) of bullish triangle. Price may down to Wave E ( Cyan) of triangle. Before a "Breakout Triangle" the GOLD's Bull Run!

POHKONG. Have Santa Clause Bought GOLD from POHKONG? 7/Sept/21POHKONG price seem still ranging above RM0.750 and still may form a triangle..

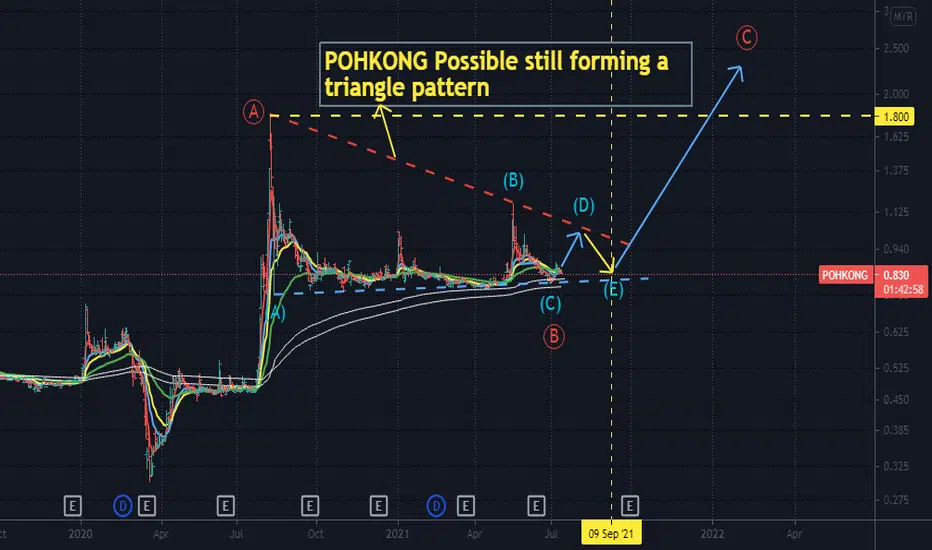
POHKONG possible still forming a triangle. 12/july/21POHKONG price still in ranging while having possibility forming a triangle pattern.