QES, The current point exhibits upward signals according to my algorithmic system, meeting various criteria. These include rising trading volume, an upward trend indicated by prices above EMA20 and EMA50, and the closing price surpassing VWAP. As a result, the present conditions suggest a potential upward trend.
QES trade ideas

QESQES (0196): Listed on the Main Board; Industrial Products & Services, Semiconductor-related.
The stock is trading above the MA200 after a minor breakout at RM0.59. The current price is above the green transition Ichimoku Kijun line. The MACD indicates a golden cross. Both the Stochastic and RSI are above 50.
✅Current price: RM0.600
✅Entry: RM0.59 - 0.60
✅Stop Loss: RM0.58
✅Resistance: RM0.61/0.65/0.73
✅Technical Target: RM0.680 - 0.690
✅Mercury & AF Apex TP: RM0.70 - 0.73
✅Risk Profile: Moderate
Hydra X
14 August 2023

QES: Support in Trend LineBest EP: 0.60
TP : 0.66
QES on fullback phase, support on trendline, based on fibo it can go until FIB 1.0 (0.66)
InsyaALLAH

QES Resistance BreakoutToday, the stock break the resistance with large volume. Then, based on weekly chart, the price also break MA20 and MA50 which is a good sign. Not only that, the stock just moving up from oversold region. Technically, I think this stock may go higher.
QES: NEAR SUPPORTQES (CASE STUDY)
Fresh demand zone 0.62-0.64, potential support HL. monitor price action when price mitigate the zone. if price breaks below 0.62, monitor next demand zone .
*Personal opinion, trade at your own risk*

QES Simple Chart AnalysisQES - We can see red chip started to react these few days as QR yet to be announce. So is clear that price had been factor in before the release which i assume will be continue once global rally start to move.
A strong support being form at 0.4 area along with a double bottom pattern. 0.49 can be an immediate support & movement will retest 0.59 towards 0.66 area.


Momentum building upQES has bucked eight straight months of market pullback, however, the share has rebounded upon touching Fibonacci level 61.8 coincides with reversal inverted head and shoulder pattern somewhere in March. The share subsequently has broken above resistance turns support level at 0.545 with bullish bias emerged by the formation of bullish symmetrical triangle pattern. The price has rose above the triangle pattern, as such, could test resistance level at 0.68. A significant price movement above the downtrend line could push the price higher. Support level is seen at 0.545.
Disclaimer: No trading strategy provided here. Our content is intended to be used and must be used for technical analysis education purposes only

qessimple idea how to trade trending counter
use smaller time frame
don't target tp so high
but still must follow good MM
entry when signal appear

QES 3.4.2022QES
Market structure cantik
dah create HH, HL, HH
so boleh cari entry point. be brave. to take a risk.
wherever entry point, there risk alwiz there.
so, try minimize ur risk and maximze ur profit.
trade as planned.

QES- Must Down A Bit MoreI predict that this correction will end soon at RM0.505 or Rm0.48- Wait yar..TAYOR..EP early also no wrong if got extra capital..

An Uptrend Pattern!The RSI indicates a strong change in price momentum due to buying interest as depicted by volume where it crosses above the MA20 line.
MACD and OBV indicate a positive uptrend pattern.
To place a bid, use VWAP as a guideline and place the bid below the VWAP line.
Let's save QES in WL and watch out for significant price movement with volume.
R 0.590
S 0.565

QES in Cypher PatternConsider to study and monitor QES' current daily chart where it resembles that of a Cypher pattern. The rebound probability to enter into a potential swing trade is between fibo extensions 1.130 and 1.414.


A bit more to complete correction I predict that this correction to complete soon. Then will continue to wave impulse if doesn't break fib retracement 0.786

QES will bullish once volume is coming?the trend line shown the potential for the QES to bullish for a while.
however, there are need significant spike in volume for the bullish to kick in.
this is for own study purpose and not buy call.

QES TECHNICAL ANALYSISTechnical analysis for QES Stock based on Trend Analysis, Chart Pattern and VPA
1) In Monthly TF
- Overall trend still maintaining the long term UTL.
- Current price candle trend from JULY-OCT 21 had retracement with price move lower accompany by decreasing volume indicates anomalies-price move lower without MM participation. Possibility this is a temporary retracement, not changing in trend.
- Latest OCT 21 monthly candle shows a short body with upper and lower wick accompany by low volume signal indecision-reversal may occur.
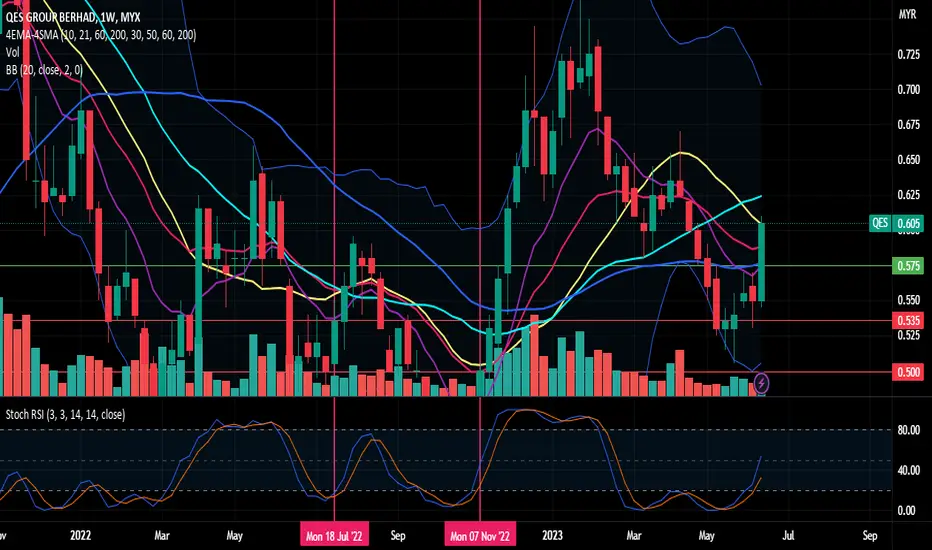
2) In Weekly TF
- Overall trend still maintaining the long term UTL and break out the mid-term DTL indicate the end of retracement.
- Current price candle trend moves in shorter range with low volume with significance VAP in 0.790-0.825 area indicate this is accumulation area. Need to look for Pivot high and Pivot low candle.
- Latest 1 Nov 21 Weekly candle show a long body with small upper and lower wick accompany by high volume break the mid-term DTL. This price action breakout is validate by volume given.
3) In Daily TF
- Overall trend still maintaining the immediate Support line and the possibility of Bullish Pennant to occur with highest VAP in 0.835-0.850 area as strong resistance area.
- Current daily price candle trend is retraced and staying at Fibo 0.50 area are implies indecision. Current price candle in congestion period with price candle move in short range accompany by low volume indicate accumulation phase occur to build up the momentum in order to break the strong resistance area above.
- Latest 5 Nov 21 candle give a long bullish candle with significance upper wick and short lower wick accompany by very high volume-volume validate the price candle. Price may move lower back to immediate support to remove significance seller that still occur in the market and to build up the momentum.

QES - Smart money resumedQES - Smart money resumed
Note: For Interested to subscribe the VT MCDX Smart Money Pro and learn Victor Trade System, and kindly contact owner
(Disclaimer: for demonstrate own planned trade records study only and education purpose, not for recommend to buy or sell. Trade at your own risk)

QES On The Way Impulse Wave 1 nearly hit. This is my view on QES, Lets compare your view on this stock.Tq

QES. Super long-term long, Long-term Short, Medium-term long, Daily swing short.
12345 impulsive appears to have been completed. Now we are in A (leading diagonal), pending a breakout to B and final corrective to C.
Please like and comment if you find this idea useful.

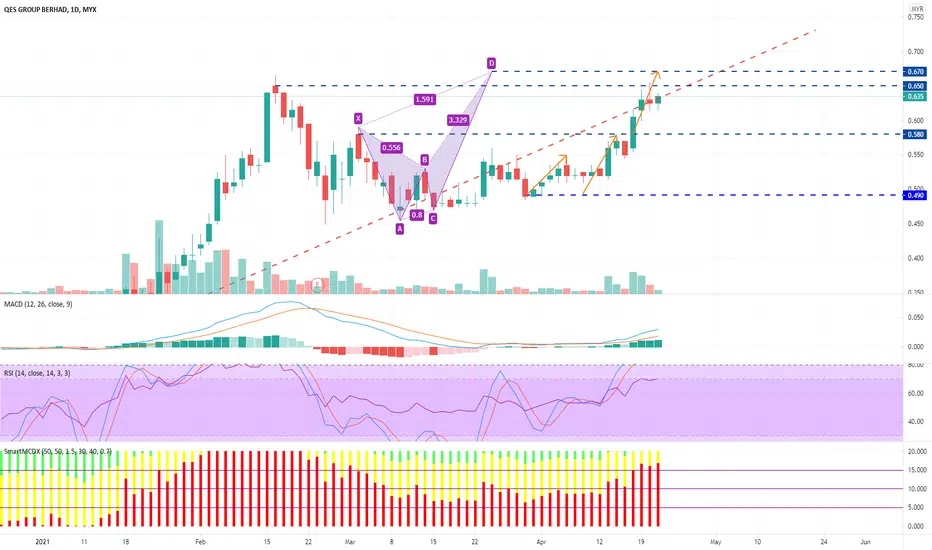
QES - 21-04-202121-04-2021
Counter : QES
Sector : Wholesale distributor
- Uptrend position, just finish retracement
- AHP Bat pattern show price can go up to 0.670, already past the resistance at 0.580 but required to breakout resistance 0.650.
- MACD above 0 and in uptrend position
- nearest strong support at 0.520
- Good smart money momentum
- Nearest resistance at 0.650