RGTBHD was triggered based on the MRV1 on 20 Dec 2023The RGTBHD buy signal was triggered based on the MRV1 setup at RM0.245. The target is a 20% increase to RM0.225, with a stop loss of RM0.165. This is expected to take 2–3 months due to the signal being based on the daily timeframe.
The price movement pattern has stagnated after a major downtrend fr
0.005 MYR
5.28 M MYR
110.40 M MYR
108.10 M
About RGT BERHAD
Sector
Industry
CEO
Seat Hoe Lim
Website
Headquarters
Simpang Ampat
Founded
1981
ISIN
MYL9954OO008
FIGI
BBG000C4FNZ2
RGT Bhd. is an investment holding company, which engages in the manufacture and sale of plastic parts and products. It operates through the Engineered Polymer Products and Factory Automation and Precision Engineering segments. The Engineered Polymer Products segment offers design, manufacture, and sale of polymer products including full assembly and related accessories. The Factory Automation and Precision Engineering segment focuses on metal parts, components, and related accessories. The company was founded by Seng Hong See and Seng Lai See on May 27, 1981 and is headquartered in Bukit Minyak, Malaysia.
Related stocks

LOW CHEAT RGTBHDDrops in YOY sales and profit,However recent quarter,improving QOQ sales and profit.Price just break horizontal line with high volume

LOW CHEAT RGTBHDFundamentally not good,reducing QOQ and YOY.Technically just breakout from pivot point of low cheat setup,with high volume and break above 200MA line

A Breakout Signal!A significant price movement with volume makes RGTBHD a breakout signal.
MACD and OBV indicators indicate a divergence signal and confirm the breakout trend.
RSI indicator >50 indicates a strong momentum of recent price changes.
Let save RGTBHD in WL and watch out for price movement with volume

RGTBHD analysisCompleted HL and in progress to make new HH
Fibo weekly retrace at 78.6% and estimate TP at 1.065 at Fibo 161.8%.
If price drop below CL and wait till reach at 61.8% fibo.

RGTBHD TECHNICAL ANALYSISTechnical analysis for RGTBHD Stock based on Trend Analysis, Chart Pattern and Fibonacci Retracement

Strong Uptrend Pattern!Continuous price movement indicates a strong uptrend pattern. The price is still within the Bollinger Band upper level. A good sign of demand and supply. MACD and OBV charts indicate a positive uptrend.
R 0.690
S 0.585

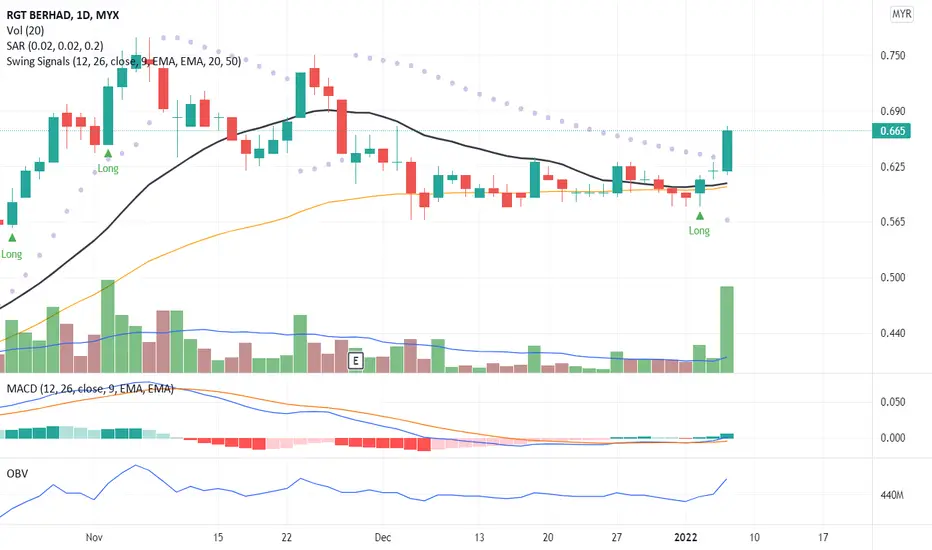
RGTBHD (BURSA WK41 2021)
Reversal at MA20 with high volume, higher high and higher low is completed.
Resistance line at 0.525 which is taking profit target as well.
======================================================================================
I am a profitable trader, here is the watch-list for Bursa Malaysia Ma

Interesting set up- RGTBHDWe realize there are increasing trading activities with this counter.
RGTBHD formed a solid triple bottoms.
Moving average turning up.
Price reached RM0.445 on 20/09/2021 but failed to break through RM0.45 with strong selling force at RM0.445
Nevertheless, price still able to keep above RM0.40 and w

See all ideas
Summarizing what the indicators are suggesting.
Oscillators
Neutral
SellBuy
Strong sellStrong buy
Strong sellSellNeutralBuyStrong buy
Oscillators
Neutral
SellBuy
Strong sellStrong buy
Strong sellSellNeutralBuyStrong buy
Summary
Neutral
SellBuy
Strong sellStrong buy
Strong sellSellNeutralBuyStrong buy
Summary
Neutral
SellBuy
Strong sellStrong buy
Strong sellSellNeutralBuyStrong buy
Summary
Neutral
SellBuy
Strong sellStrong buy
Strong sellSellNeutralBuyStrong buy
Moving Averages
Neutral
SellBuy
Strong sellStrong buy
Strong sellSellNeutralBuyStrong buy
Moving Averages
Neutral
SellBuy
Strong sellStrong buy
Strong sellSellNeutralBuyStrong buy
Displays a symbol's price movements over previous years to identify recurring trends.
Frequently Asked Questions
The current price of RGTBHD is 0.220 MYR — it has decreased by −2.22% in the past 24 hours. Watch RGT BERHAD stock price performance more closely on the chart.
Depending on the exchange, the stock ticker may vary. For instance, on MYX exchange RGT BERHAD stocks are traded under the ticker RGTBHD.
RGTBHD stock has fallen by −10.20% compared to the previous week, the month change is a −18.52% fall, over the last year RGT BERHAD has showed a −67.88% decrease.
RGTBHD reached its all-time high on Nov 14, 1996 with the price of 8.585 MYR, and its all-time low was 0.085 MYR and was reached on Jan 6, 2017. View more price dynamics on RGTBHD chart.
See other stocks reaching their highest and lowest prices.
See other stocks reaching their highest and lowest prices.
RGTBHD stock is 4.65% volatile and has beta coefficient of 0.97. Track RGT BERHAD stock price on the chart and check out the list of the most volatile stocks — is RGT BERHAD there?
Today RGT BERHAD has the market capitalization of 75.63 M, it has increased by 1.96% over the last week.
Yes, you can track RGT BERHAD financials in yearly and quarterly reports right on TradingView.
RGTBHD net income for the last quarter is 460.00 K MYR, while the quarter before that showed 2.00 M MYR of net income which accounts for −77.02% change. Track more RGT BERHAD financial stats to get the full picture.
RGT BERHAD dividend yield was 2.24% in 2024, and payout ratio reached 119.21%. The year before the numbers were 0.00% and 0.00% correspondingly. See high-dividend stocks and find more opportunities for your portfolio.
EBITDA measures a company's operating performance, its growth signifies an improvement in the efficiency of a company. RGT BERHAD EBITDA is 17.81 M MYR, and current EBITDA margin is 9.21%. See more stats in RGT BERHAD financial statements.
Like other stocks, RGTBHD shares are traded on stock exchanges, e.g. Nasdaq, Nyse, Euronext, and the easiest way to buy them is through an online stock broker. To do this, you need to open an account and follow a broker's procedures, then start trading. You can trade RGT BERHAD stock right from TradingView charts — choose your broker and connect to your account.
Investing in stocks requires a comprehensive research: you should carefully study all the available data, e.g. company's financials, related news, and its technical analysis. So RGT BERHAD technincal analysis shows the sell today, and its 1 week rating is strong sell. Since market conditions are prone to changes, it's worth looking a bit further into the future — according to the 1 month rating RGT BERHAD stock shows the sell signal. See more of RGT BERHAD technicals for a more comprehensive analysis.
If you're still not sure, try looking for inspiration in our curated watchlists.
If you're still not sure, try looking for inspiration in our curated watchlists.