SALUTE - Looking for bullish continuationN wave with E, N, V & NT projection.
The price is currently at 0.280, slightly below recent highs around 0.290–0.295.
Recent candles show some selling pressure, indicated by a volume increase and a drop from the highs.
Price is currently trading near the edge and above the Kumo suggesting a bullish momentum.
Immediate support: NT level at 0.275.
If price holds above NT level 0.275:
Look for consolidation or potential bounce. This level acts as a pivot; a bounce here could test recent highs again near 0.295 and potentially higher.
If price drops below the NT level, the next key support is around 0.260 marked by a previous consolidation zone and a potential bounce area.
A break below NT might signal a deeper correction or trend test.
Price action at NT (0.275):
Look for reversal patterns like bullish engulfing, hammer, or increased buying volume before entry.
Volume:
Confirm strength of rallies with higher volumes on up days.
Breakouts:
If price breaks and closes convincingly above recent highs (0.295), it could signal continuation towards the next targets.
Caution:
A breakdown below 0.260 suggests potential for deeper correction. Adjust stop loss and risk accordingly.
Note:
1. Analysis for education purposes only.
2. Trade at your own risk.
SALUTE trade ideas

Salutica Berhad LongSuggest long position for Salutica Berhad, as price reach almost previous low. This is a chance to entry with small invalidation range. with RR 1:5 it is best to consider this counter.

SALUTELong Position: When an investor takes a long position, they are buying shares with the expectation that the price will go up. For example, if you buy 100 shares of a company, you are said to be "long" those shares. The goal is to sell them at a higher price in the future and make a profit

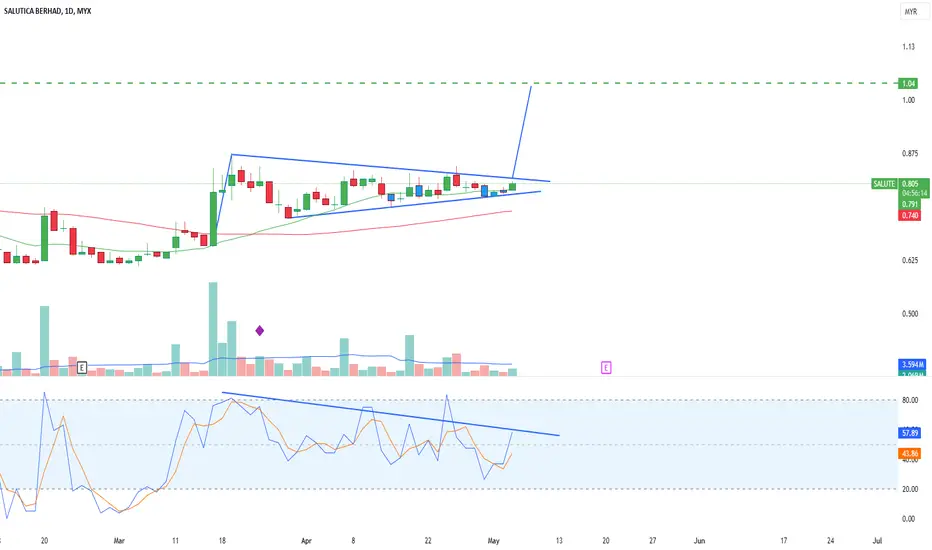
SALUTE- Making a consolidation in ascending triangle
- Expecting to breakout the triangle TP 950
- My view as long as the price in the triangle higher chance for SALUTE to make a solid green candlestick

SALUTE- Bullish divergence detected
- If break the triangle can target at 1.04
- Volume is increasing
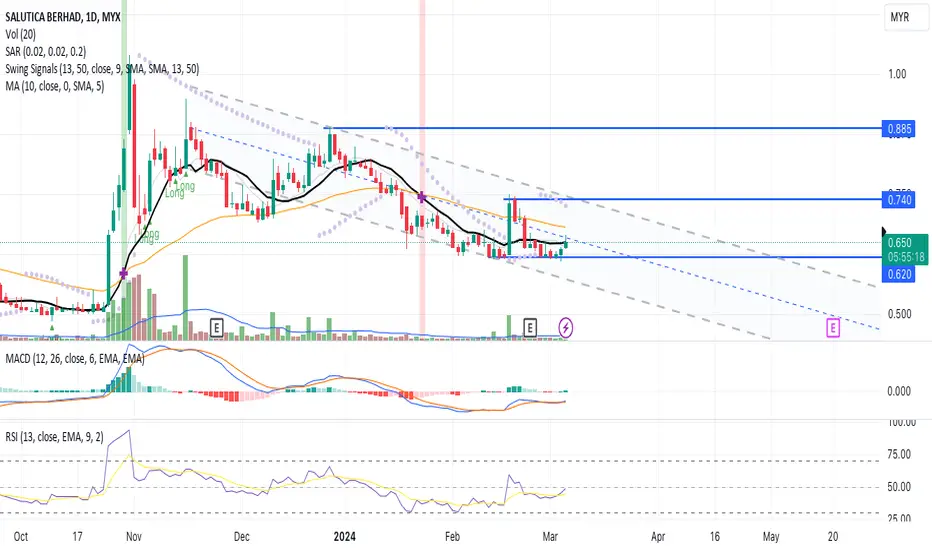
A Reversal Pattern!The candlestick pattern indicates a reversal pattern where the price having a positive momentum towards the MA line without significant in trading volume. Therefore, a precaution for a potenticial price reversal.
The price channel indicator provide the upper and lower bound of the price range during a market trend. The indicator uses the highest highs and lowest lows to form the channel, with the upper and lower lines representing support and resistance areas
MACD and RSI indicate a positive signal hence confirming the price momemtum towards next price resistance.
Let's SALUTE in WL and watch out for price uptrend towards next price peak resistance with result in volume above the MA line.
R 0.740
S 0.620
SALUTE, watch out the downtrend line>> has to break the said downtrend line.
>> 0.715 as nearest Rst.
Know yourself well and know the "Hot Tip" well.
If you have diabetes, and milk tea is going for buy 1 free 2, will you still fear of missing out?
Disclaimer: Mentioned stocks are solely based on own opinions for education and/or discussion purpose only. There's no buy and/or sell recommendation. Trading involve financial risk on your own. The author shall not be responsible for any losses or lost profits resulting from investment decisions based on the use of the information contained herein.

Looking at SALUTE for another wave upAfter pulling back and consolidating, I am looking at MYX:SALUTE to stage another wave up.
Trigger: 0.965
Stop: 0.87
Targets: 1.28,then 1.57
These are my views and analysis and is only used for educational purposes. I am not a financial advisor.
Nothing in the information posted here is intended to be or should be interpreted as trading advice.

Price will arrive at strong supportI found a Potential area to place a buy order and hold...will update the Tp1 area if the price manages to reject at this support

Salute...Salutica mungkin telah habis penurunan... Harga nampak stabil & tampak berlaku sedikit lonjakan harga...

SALUTE IN FLAG AND CYPHER FORMATIONConsider to study, analyse and monitor SALUTE where its current daily chart resembles that of a bullish flag and bearish cypher formations. Price has been consolidating at fibo1.130 which is the potential EP at 0480. Probable exit if price falls below the 52-week low at 0460. The potential final TP is at Point D at 0.680.

SALUTE IN HARMONIC PATTERNSALUTE spotted in bullish flag formation and bearish cypher pattern and likely rebounding at fibo1.130 which is the entry price. See proposed trade plan for potential swing trade.


Trading Idea SALUTE (22/3/2021) Trading Idea SALUTE (22/3/2021)
- Accumulation phase
- Buying opportunity in yellow zone
- Target and stoploss as drawn
Disclaimer: This trading idea is strictly intended for informational purposes only so please do your own analysis before making any investment decision.

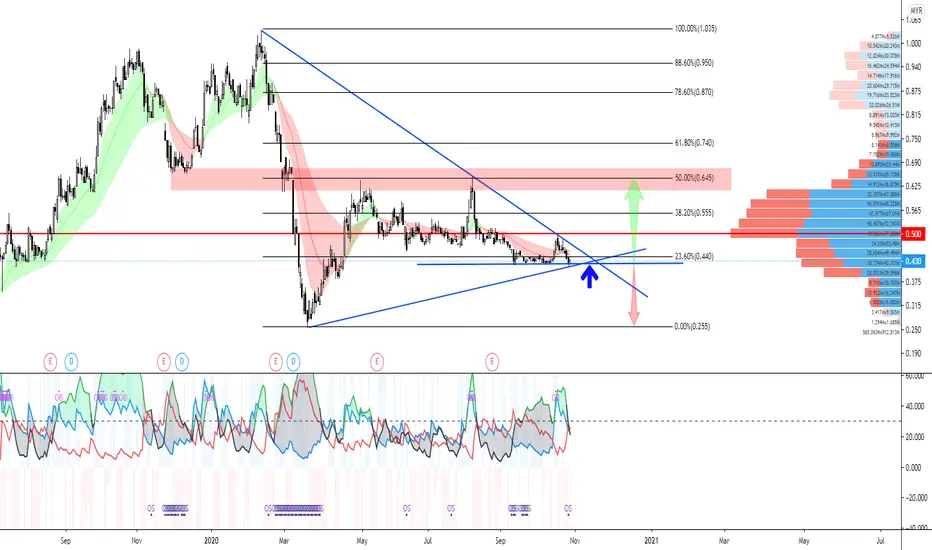
SALUTE EW+FIBO Traditional TP: 1.045
Aggressive TP: 1.145
Descending channel of accumulation phase from April 2020 until forming LPS (december). Markup phase now rallying into W3 TP at 0.8.

SALUTE - Short Term Bullish if Decisively Break Trendline
Please consider your own interpretation of Opportunity & Risk:
NO BUY CALLS OR INVESTMENT ADVISED ARE PROVIDED.
DISCLAIMER: This analysis is for reference and learning purposes only. It is based on my personal view in the market from a technical analysis standpoint. None of information posted in this chart can be used as investment decisions or investment advises to any parties. Do not trade solely on the information posted in this page. Trade at your own risk and judgement. A trader could potentially lose all money. Only risk capital that can be lost without jeopardizing ones financial security of lifestyle. Please seek licensed professional guidance if you plan to invest your capital seriously.
PENAFIAN: Analysis ini hanyalah untuk tujuan rujukkan dan pembelajaran sahaja dan bukan cadangan untuk membeli atau menjual stok atau apa jua jenis instrumen kewangan. Anda dinasihatkan untuk menghubungi remieser / dealer / bank pelaburan yang mempunyai lesen atau kelayakan yang sah untuk bertanyakan pendapat dan menguruskan pelaburan anda. Pelaburan dan perdagangan mempunyai risiko tinggi, dan ianya adalah Risiko Anda Sendiri.

SALUTE: Potential BuyBuy upon breakout above 0.560 with take profit target at 0.625, 0.695. Cutloss if fall below 0.52/0.46.

SALUTE dijangka akan membuat pullbackSALUTE dijangka akan membuat pullback pada horizontal support line dan trendline support 0.580


{SWC}——SALUTE, Time to Salute!Thank you for your continued support :)
Strategy: Price Volume Analysis
Bias: Bullish . Salute made a breakout with volume above the resistance zone of RM0.940. SWC spotted this few days earlier and already mentioned in the SWC trading ideas channel.
The big player was accumulating the ticket at RM0.935 zone to recharge for a breakout above the resistance.
The long signal was confirmed with the further breakout above the BB upper zone, indicating a significant momentum.
It should further break RM1.00 in very very short term and will head towards RM1.04, RM1.06, RM1.09!
It formed rising flag pattern earlier and is forming a cup and handle pending for further breakout!
Stay tune for the profit!
If you find this idea helpful, kindly drop us a like and leave your comment!

Should I sell off my stocks?Should I be selling off my shares? Well the official reply to that is you have to decide that yourself as market analysis, we analyse and spot potential reversal zone.
0183 is a relatively new stock data only start from 16May2016 not much can read off from this.
The 2 potential prices to look into after the market cross the psychological level of $1.00 will be $1.085 but a more important key level will be $1.265.
At these resistance(upper restraint) level are potential "sell-off". In my trading decision, I look into the "think like other traders", if people are exiting the market what are the price they are looking at?
Psychological Level will be $1.000, if the weekly candle break and close above $1.000 I will have no concent until price touches $1.085 as it forms structure restrain, breaking and closing above I will be looking to exit at $1.265, a price that I expect huge market movement.
