SAMAIDAN, where the next low?The price has broken through multiple support levels, showing continued weakness with no strong reversal signals yet. The downtrend remains intact, and unless a solid base is formed, further downside movement is possible.
Key Considerations:
Support & Reversal Area: As no significant buying pressure has emerged, the next key level to watch is where price stabilizes and forms a potential reversal pattern, such as a double bottom, bullish divergence on RSI, or strong volume accumulation.
RSI & MACD Signals: If RSI reaches oversold conditions with bullish divergence while MACD starts to turn upward, it could indicate a possible reversal. However, confirmation is needed before considering an entry.
Trend Strength: The current price action suggests weak momentum, and blindly accumulating at this stage carries high risk. Waiting for clearer signs of stabilization or a confirmed breakout is a more prudent approach.
Should You Start Collecting?
For myself, I wouldn’t rush into accumulating blindly. Instead, I would:
1. Wait for a Base Formation: Look for strong support and consolidation before considering entry.
2. Watch for Volume Confirmation: Increased buying volume at support can indicate institutional accumulation.
3. Monitor Key Indicators: Oversold RSI, MACD crossover above zero, or bullish candlestick patterns could signal a potential turnaround.
Potential Trade Plan:
If a strong support emerges, look for confirmation before entering.
If the downtrend continues, stay patient and wait for a reversal signal.
Avoid catching a falling knife.... let the market show clear signs of strength first.
Disclaimer: Please be informed that all stock picks are solely for educational and discussion purposes; they are neither trading advice nor an invitation to trade. For trading advice, please consult your remisier or dealer representative.
SAMAIDEN trade ideas

SAMAIDEN poised for next uptrend wavecorrrection at 0.382
risk reward ratio is good
Here are the key elements I observe:
1. Price Movement:
- The chart shows candlestick patterns with both red and green candles
- Current price appears to be around 1.03 MYR (Malaysian Ringgit)
- There are multiple price levels marked with Fibonacci retracement levels (shown as horizontal lines)
2. Technical Indicators:
- Moving averages shown as curved lines in different colors
- Volume bars at the bottom of the chart (green and red bars)
- Various numbered points (1-5) marking significant price levels or movements
- Wave patterns labeled with roman numerals (iii, iv, v)
3. Trading Information:
- Buy level marked at 1.16
- Sell level marked at 1.15
- Target price shown as 0.09 (7.76%)
- Stop loss level appears to be set at 0.04 (3.45%)
- Risk/Reward ratio indicated as 2.25
4. Time Frame:
- The chart appears to be showing recent price action with data points marked for September 2024
- Volume analysis indicates varying levels of trading activity throughout the period
5. Market Status:
- The stock appears to be in a corrective phase after reaching a peak marked by point 5
- Multiple support and resistance levels are clearly marked on the chart
The overall chart seems to be a detailed technical analysis setup used for trading decisions with multiple indicators and price levels to guide entry and exit points.

Samaiden, AlgoSignal reveals potential uptrendSeveral indicators within my algorithmic system are signaling a potential uptrend. These include:
- Increased volume: Activity is picking up, suggesting growing interest and potential momentum.
- Mid- to long-term uptrend: Both the 50-day and 150-day exponential moving averages are pointing upward, indicating a sustained positive trajectory.
These factors collectively point towards the possibility of an upward movement in the near future

SAMAIDEN WILL MARKING UP ?This is an Atypical Reaccumulation Trading Range , which fall under Schematic #2
Based on Bigger view, looks like current price action is on going BUEC
This leads me to a conclusion that a Mark Up is impending
Thus, position initiated as attached
Pure Wyckoff

Samaiden, AlgoSignal reveals potential uptrend
Several indicators within my algorithmic system are signaling a potential uptrend. These include:
- Increased volume: Activity is picking up, suggesting growing interest and potential momentum.
- Mid- to long-term uptrend: Both the 50-day and 150-day exponential moving averages are pointing upward, indicating a sustained positive trajectory.
These factors collectively point towards the possibility of an upward movement in the near future

SAMAIDEN Cup & Handle pattern. TP 30%++ SAMAIDEN is forming a perfect cup & handle pattern.
Time Frame: 4H
Sentiment: Bullish
Risk reward 1:2
Entry 1.3
Expecting it will breaking up previous new high, around RM 1.36, and going all the way up.
Write your thought in the comment session :)
P.S
Please, note that an oversold/overbought condition can last for a long time, and therefore being oversold/overbought doesn't mean a price rally will come soon, or at all.
Like my works? Please hit the Like, Follow and Share or tip me a coin :)
Thanks!
Disclaimer
This information only serves as study references, does not constitute a buy or sell call.


SAMAIDEN: BAKAL MENGULANG SEJARAH?Structure: UPTREND
Trading range: 0.73-1.03
Wujud Trendline Liquidity
Fresh demand area 0.8, zone potensi untuk rebound
❗️Personal opinion, trade at your own risk
@RasenganTrader

Samaiden, cunning shark wash-a-byeSamaiden, a very tricky stock counter which require a strong heart holder and faith on it.
A false breakdown to VCP support line and immediate pull back and surging high. With my safe entry price at RM0.760, now I have 10% profit margin in hand.
My TP1 will be 0.950 and TP2 will be 1.120.
Let's dont let the music stop.

SAMAIDEN: BO TRIANGLE#SAMAIDEN (CASE STUDY)
Setup: BODTL + RBR
TP1: 0.91-0.93
Worth to monitor 👌
*Personal opinion, trade at your own risk*

Samaiden, landing at EMA200 important supportMy chart does not need a lot of complicated indicator. So I always got Moderator to label as "not suggested" publish.
If indicator is working, why so there are still so many people losing money?
If indicator is not working, then why still so many so call Analyst publish a so complicated line flying here and there?
Only when you understand the pricing behaviour, then you are able to take money from the stock market
Samaiden, landing at important support EMA200 line. Stop loss at 0.675. The rest let market to decide. Keep it Simple, Samaiden.

SAMAIDEN SPOTTED IN DOUBLE BOTTOMSAMAIDEN spotted in double-bottom formation. Monitor for potential neckline break-out and retest and consider to enter trade.

DARVAS BOX SAMAIDENSamaiden,long time no see huh?Inclining sales and profits for 2 quarters consecutively.Price still inside the box.Looks for breaks and closed above the box with high volume

SAMAIDEN TECHNICAL ANALYSISTechnical analysis for SAMAIDEN Stock based on Trend Analysis, Chart Pattern and Fibonacci Retracement

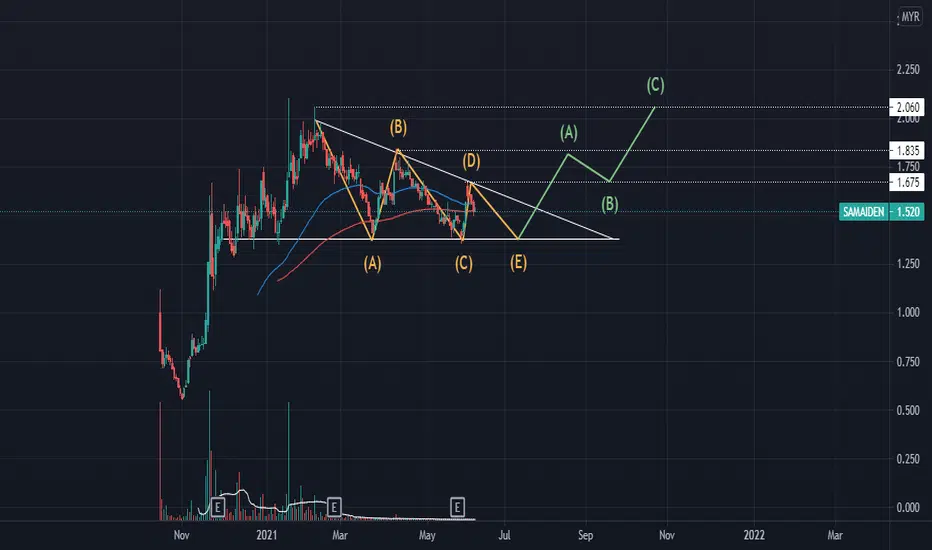
SAMAIDENcompletion of ABCDE leading diagonal. Primary B wave up - to unfold in 3 waves abc. Expect target of c of B in either of greenzones. This is not a trading idea, merely to share charting purely for education purposes. Please do your own due diligence.
Like and comment if you find this useful. Thank you.

SAMAIDEN may done its correction @ around 0.990. 21/10/21SAMAIDEN probably have done its pullback at around RM0.990 as previous post ideas at ... Price is trending now and may break Rm2.00

SAMAIDEN WAVE WXYXZ Correction wave WXYXZ maybe ending at fibonacci retracement 0.618. Expected to make Wave ABC or new uptrend impulsive wave 12345.
.
Wave A can go up to 0.382 before testing the downtrend line / channel before moving upwards.

SAMAIDEN Daily TimeframeTheme : renewable energy
Leader vs laggard : Potential leader
Daily TF : Uptrend but correction mode
Trigger point : Volume rush in
Candlestick : Detected some reversal type
Assumption : Still need to break SBR, downtrend line and EMA10
Game plan : TAYOR

SAMAIDEN. solar enrg stock. Major Support @ ≈0.990. 3/7/21SAMAIDEN. "A Solar Energy Related" stock may resuming its uptrend at around Rm 0.990 where there is a confluence zone of 1) Next Major Demand Zone 2) Support area of lower trend line of the Wedge pattern

SAMAIDEN: WAITING FOR ENTRY SIGNALWe will wait at the confirmation zone for the signal of entry. Take profit will be done @ near resistant level.
TAYOR!

SAMAIDEEN: CAN IT POSSIBLY TEST 2.055? Samaideen is in bullish mode. I think it will possibly test the near resistant level @ 2.055 in the near term.
TAYOR!

Coffee HighA little "jump" on morning session, maintained above a valid DTL and support turns resistance at 1.660. We are optimist on further bullish movement towards 2.25. Support is seen at 1.40.
Disclaimer: No trading strategy provided here. Our content is intended to be used and must be used for technical analysis education purposes only
