Samchem, potential rebound or continue pullback?>> base on 1h, it may continue to pullback
>> 565 area for potential rebound, if price above to support.
Let see how it work.
When a stock / index has gone up substantially, we must be more care if we decide to get involve in it...
monitor closely and be agile....
we cannot PREDICT what definitely will happen ~ we can only RESPONSE to what we see!
Disclaimer: Mentioned stocks are solely based on own opinions for education and/or discussion purpose only. There's no buy and/or sell recommendation. Trading involve financial risk on your own. The author shall not be responsible for any losses or lost profits resulting from investment decisions based on the use of the information contained herein.
SAMCHEM trade ideas

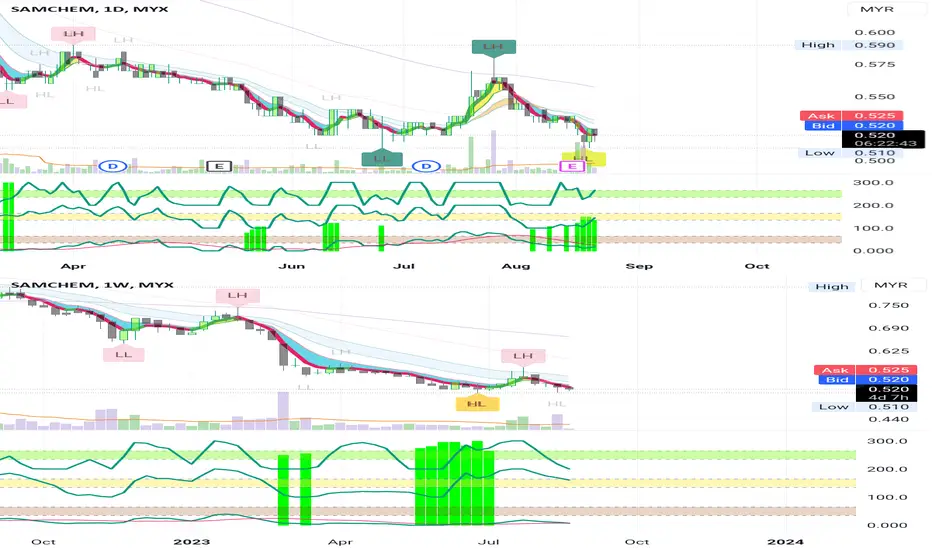
SAMCHEM - Potential to bounce higher?Very obvious it's a downtrend stock.
Some afraid of catching the falling knife.
However, base on :
>> weekly chart, it show a potential rebound as long as the price stay above 510 and brake above 530.
>> day chart, it may slightly retrace. Best is stay above blue cloud ☁️ EMA. Let it form an upstair staircase.
Overall, operator yet push this counter. Mostly play by retailers (Swing Traders & scalpers) only.
Disclaimer: Mentioned stocks are solely based on own opinions for education and/or discussion purpose only. There's no buy and/or sell recommendation. Trading involve financial risk on your own. The author shall not be responsible for any losses or lost profits resulting from investment decisions based on the use of the information contained herein.
SAMCHEM is it Ready for Departure?SAMCHEM is it Ready for Departure this third time around?
Station 1.06 gonna could be a tough call! However with the in-coming results...will it make the difference?
Disclaimer: The chart shared here, attracts the writer's attention. It is author's view...and there is no guarantee on the movement of the asset price in the future. Any investment decision you make is your own decision which you MUST review yourself and be solely responsible. This study does not constitutes Buy/Sell per say. Please consult your financial advisor before making any trading/investing decision.

VCP for Sanchem?VCP in making for Samchem?
Possible trading strategy
1. Bottom trendline can be good entry point as long as price moving in between the triangle.
2. Breaking out above VCP triangle potential major uptrend coming.
Cautious
1. Breaking below triangle should consider for first signal cut lose while waiting further long term trend.
Trade at your own risk. Information should not be considered as an offer or enticement to buy, sell or trade. You should seek appropriate advice from your broker, or licensed investment advisor, before taking any action. Past performance does not guarantee future results.

<TradeVSA> Re-Accumulation with VCP - SAMCHEMSign of Strength in the chart:
1. VCP Setup with no Sign of Distribution
2. Potential CoC
Disclaimer
This information only serves as reference information and does not constitute a buy or sell call. Conduct your own research and assessment before deciding to buy or sell any stock

SAMCHEM- COLLECTION 0.80-0.82 (TARGET 15-20%)IDEAS:
1. Good building of overall technical strength, BBD in positive zone.
2. Looking forward for a 15-20% gain.

SAMCHEM potential upside TP 0.930Our BMS technical chart detected Signal 2 bullish signal and we see potential to revisit near term resistance TP at 0.930. Immediate support at 0.780.
Once breakout XMA3 at 0.840 and with support of volume price will move higher.

SAMCHEM IN ABC FORMATIONCan study and monitor SAMCHEM's chart pattern. From 0.650 swing low on 5 August 2021 to a swing high of 1.070 (ie 52wh) on 25 October 2021, SAMCHEM retraced to 0.770 which is in-between fibo786 and 618 levels. At present, SAMCHEM's price has crossed EMA200 and fibo618. Probable EP would be 0.820 to retest a yearly pivot and probable TP would be at 0.950, that is, in-between fibo382 and 236. The probable CL would be at 0.745, that is, below fibo786. This is not an investment call but for study and monitoring purposes only.

Momentum play- SAMCHEM BHDPrice able to closed at previous high RM0.92
Really good market sentiment last Friday.
Company making higher revenue.
Keep monitor for proper entry-point


SAMCHEM (BURSA WK41 2021)Bull trend is on going, each reversal also can be rebound at MA20.
0.92 is the entry point with high volume.
Resistance line 1 & 2 is respectively 0.975 and 1.03, taking profit will be observed if it could break out resistance lines.
MACD and Stochastic also appeared "golden cross" signal.
=============================================================================================================
I am a profitable trader, here is the watch-list for Bursa Malaysia Market.
-TGL Engineered Excellence-

is SAMCHEM providing the GOLDEN opportunity for investors?Introduction to SAMCHEM
SAMCHEM's core business is the distribution of chemicals to over 7000 clients in various industries that would benefit from the global economic recovery.
SAMCHEM’s distributed product mix are:
Polyurethane(PU): mattresses, car seats
intermediate chemicals used in manufacturing, construction, agricultural, adhesives, industrial cleaning, oil and gas
specialty chemicals used in paints and coatings, printing ink, cosmetics, personal care products
The Group distributes about 500 products of which they hold formal distribution rights acquired from world-renowned chemical manufacturers such as ExxonMobil, Shell EP, BASF PETRONAS, OPTIMAL Chemicals, etc. Within its distribution value chain, SAMCHEM also offers integrated logistics including warehousing, bulk breaking and blending of chemicals.
In FY2020, 54.3% of its revenue were generated domestically, whilst 30% were generated from its Vietnam operations and 15.7% from its Indonesia operations.
The forecasted GDP growth in 2021 of said countries are as below:
1) Malaysia: +7.8%
2) Vietnam: +6.7%
3) Indonesia: +6.1%
Source:
i)SAMCHEM Annual Report (2020)
ii)Statista Research Department (2021)
Tehcnical Outlook :
The Bullish take
1)Price has corrected significantly (32%) from its highs. As no stock goes up or down continuously in a straight line, a short term rebound should occur soon.
2)The latest candle formed is a hammer which suggests a reversal to the upside (to be confirmed by tomorrow's candle closing at or above the hammer closing)
3)The price is hovering close above to its MA200 trend line, a level well respected by long term investors in making investment decisions.
4)RSI has hit oversold, suggesting a short term rebound to occur. Note that there are also cases where the RSI of a stock remains oversold for a long period of time.
5)Hidden Bullish divergence of the RSI in the 1-hour and 2-hour time frame. (Not seen on published chart)
6)Rate of fall of the MACD is decreasing, a timely golden cross paired with the rebound of the RSI and a breakout of resistance would be a significant impetus for SAMCHEM's share price.
7)Price is currently supported above EMA42 on the weekly timeframe (not seen on published chart)
All the above suggests that the current price may be a good entry point for investors of SAMCHEM and a short term rebound may be around the corner.
Whether a bullish continuation of the current mid term uptrend would continue or not cannot be certain at the moment but would be clearer as time goes on.
The bearish take
1) EMA18 has crossed below EMA42
2) Current MACD DC below 0
The above suggests that the stock price of SAMCHEM may see further downside.
These are my takes on SAMCHEM. I welcome any constructive criticism in the comments below. Please note that the final decision to buy/sell is yours.
Thank you.
-FairTrades

MULTI MONTH UPTREND, JUST BEGINNING [SAMCHEM]After 3 months of consolidation, SAMCHEM is waking up and ROARING to start its new multi month BULL WAVE.
Its technical signals are all pointing towards a bullish uptrend that one should not miss out on.
For this posting, I will just focus on the technical aspects of the stock.
For the fundamentals of SAMCHEM, see previous posting dated 5th Jul 2021, titled
The current Weekly Technical indicators of SAMCHEM:
i) MACD Golden Cross above 0. Strongly suggests the start of a multi week / multi month uptrend
ii) Weekly candlestick closing formed a green hammer. Depicts that the buyers are greatly in control of the price and dominating sellers.
iii) Short term RSI > Mid term RSI. The strength of the uptrend is improving and gaining traction as more and more people begin to invest in SAMCHEM.
iv) Using the Fibonacci Extension tool (not shown in chart), an extension of 1.618 depicting the 3rd wave of the Elliot Wave would result in a peak of RM 2.04.
The key resistance for SAMCHEM to overcome is RM 0.94. After which it will be blue skies ahead for SAMCHEM for weeks and months to come. Good luck!
Please note that the final decision to buy/sell is yours. Thank you.
-FairTrades

VCP SETUP SAMCHEMsector : trading and services.Fundamentally top notch.Increasing QOQ 4quarters consecutively and increase YOY.Supported with institutional holder.Latest director share purchased was last week.Technically just broke up pivot point of VCP setup.

Samchem Potential UptrendMACD Divergence, Recently with high volume, Estimate will hit TP1 in the very short term then TP2

Samchem - Super Bullish Buy on BreakoutOne of my few favourite stocks forming rounding bottom with Cup & Handle. Projected to breach ATH resistance at 1.530.
Support at 1.455.
Disclaimer: Trade at your own risk.

SAMCHEM SLOW TURTLE BUYMYX:SAMCHEM
UPTREND
SLOW TURTLE BUY
FiFT +VE SPIKE UP
MCDX+ BANKER SPIKE UP
BANKER 40%
ATOM BUY


SAMCHEM - All Time High +60% All time high.
Uptrend,
Very Bullish and Strong Bull
Up 60% since last post on 4th Oct. Slow but steady.
Banker spike to 88%
Hold or look for opportunity to further buy.

SamChem Resistant breakoutSAMCHEM has almost reached previous high.
Volume increase and last bar close show that buyer interest increase.
TP will be 20%++
Risk & reward ratio : 1.5
Like my works? Please hit the Like, Follow and Share :)
Thanks!
Disclaimer
This information only serves as study references, does not constitute a buy or sell call.

SAMCHEM VCP DEVELOPMENTSAMCHEM volatility contraction pattern setup almost complete.
C1: ~47%
C2: ~17%
C3: ~16%
C4: ~8%
Buy at break 1.20 and Support at 1.12. Around 8% risk!
When Demand > Supply it will fly to sky.
Disclaimer: Just sharing purpose on technical analysis. Buy at your own risk. Consult your personal financial planner for investment.

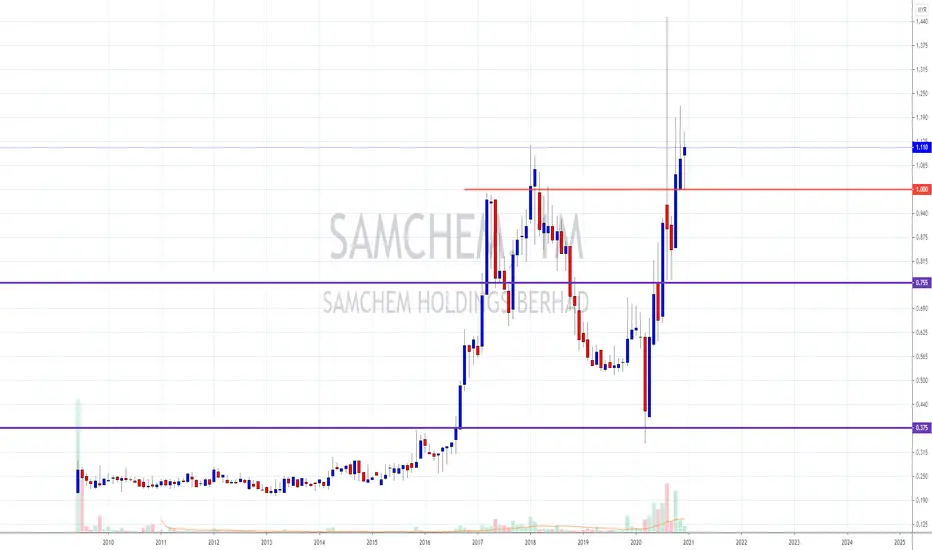
SAMCHEM STOCK PICK FROM EXPERT 03012021
2021 STOCK PICK FROM EXPERTS
PURPLE LINE = STRONGER SUPPORT
RED LINE = MINOR SUPPORT
Disclaimer:
Please be informed that above analysis are solely for education purpose; it is neither a trading advice nor an invitation to trade. For trading advice, please speak to your remisier or dealer representative.
You are responsible for your own risk management Do Your Own Due Diligence
I FORGOT TO PUBLISHED THIS STOCKJust a good break 1.05, but i have to wait for a good buying power before place a position. Finally take my nice profit.
