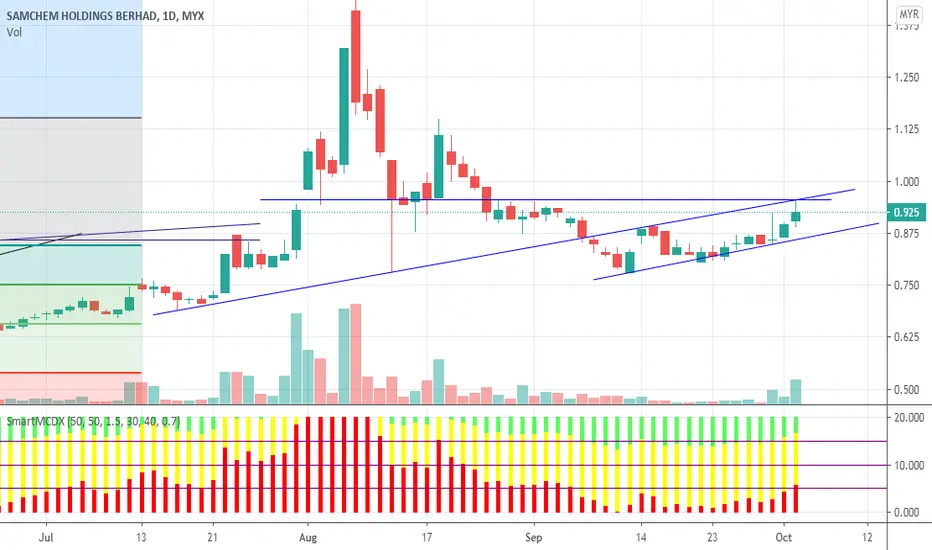
SAMCHEM: watch out for Fake Strong UptrendHHHL
Y1> 1
Very unlikely the price will break previous high.
X2 is way longer than X1.
Either the price will turn sideway, or slowly losing upward strength, then reversal down into downtrend.
SAMCHEM trade ideas

SAMCHEM-MENARIK UNTUK SWING?SAMCHEM MACD TUNJUK DALAM RETRACEMENT MOOD
INSYA ALLAH BOLEH SWING HINGGA 2 BULAN
BOLEH EP PADA HARGA SEMASA,MACD BARU NAK CROSS BALIK,RSI>50

SANCHEM - Accumulating ? Breaks above EMA50 but profit taking on Friday afternoon
First ATOM Buy after long squeeze
MCDX+ Banker's BAR remain strong and increasing.
FiFT +ve with Volume spike.
Looking to buy near EMA50 or accumulate with SL below EMA50 (low risk)


Samchem, 0.955 need to break firstShort term resistance at 0.955.
TP1 is 1.11
Increading MACD bar.
weekly chart rebounding from Fibo 0.618.
healthcare theme play
Healthy for Mid to long term play.
SAMCHEM LongSamchem has completed its wave-2 retracement. It is on the verge of wave-3 launch with first TP: 0.885.

Triangle Consolidation Breakout: SAMCHEMChart Pattern: Triangle Consolidation Breakout
SAMCHEM has formed a triangle consolidation pattern in the past week and the price has just broken out the downtrend resistance line, giving us a signal to buy in the stock.
Based on the triangle breakout calculation, final target price would be 0.855. However, the risk-averse investors could set their first tp at previous high (0.755).
Remark: Trade at your own risk.

SAMCHEM, Could a Long Term Reversal Be in the Cards?Bias: Bullish. When SAMCHEM broke the blue long period MA line resistance, it rallied strongly. In the correction that followed, priced dropped up to 15% between highest point and lowest point in 5 trading days. As price appoached the same blue MA, it could be a buy-in oppurtunity if the breakout/reversal is to be true.
Stop-loss: 0.635
// The recent low point 0.640.
1st target: 0.755
// Previous high as minor resistance.
2nd target: 0.885
// Fibonacci extension & previous trading zone.
Gentle reminder: Plan the trade and trade the plan. Trade at your own risk. Stay tune!
Guys, if you like the idea, please "like" it, this will be the best thanks.
If you have any questions or trading ideas, please post them in comments!
Thank you for your support, we appreciate it.
