SAPNRG trade ideas


SAPURA LONG( IF BREAK TL, STRONGLY TO CUTLOSS)SAPURA NOW IS CONSIDER DISCOUNT PRICE. HOWEVER, BE CAREFUL IF PRICE DOWN TO BELOW SUPPORT.
<TradeVSA> Hibiscus & C5 vs Sapura & C76 by MacquireStrength in the chart:
1. Shakeout pattern
2. Back to support in the accumulation
3. Potential pullback trade
Disclaimer
This information only serves as reference information and does not constitute a buy or sell call. Conduct your own research and assessment before deciding to buy or sell any stock


<TradeVSA> Sapura Energy - Accumulation with StrengthStrength in the chart:
1. Accumulation with shakeout
2. Upbars with volume
Send us your preference stock to review based on TradeVSA chart by comment at below.
Disclaimer
This information only serves as reference information and does not constitute a buy or sell call. Conduct your own research and assessment before deciding to buy or sell any stock

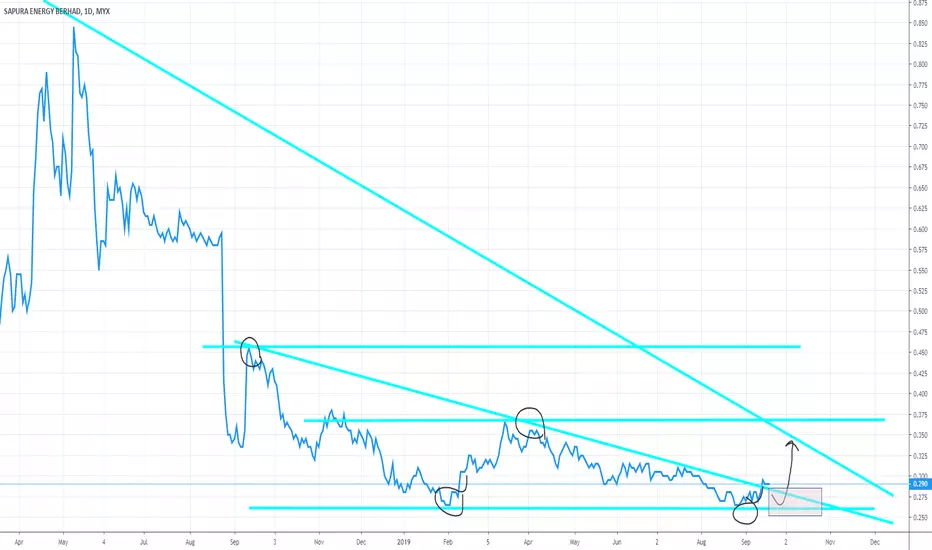
SAPURA ENERGY BERHAD, 1DLooking a good bounce SnR in trend line. Have a major R. if it break the 1st R, the price will goes up because the EMA trend is up now.
If the price cannot break the 1st R, the price will bounce back to Support line

Stock Review - Armada, TRC, Ni Hsin, AirAsia & SapuraSend us your preference stock to review based on TradeVSA chart by comment at below.
Disclaimer
This information only serves as reference information and does not constitute a buy or sell call. Conduct your own research and assessment before deciding to buy or sell any stock

SAPNRG - NeutralTechnical Update: Sapura Energy Berhad (5218)
Based on the weekly chart below, SAPNRG attempted to break its 6-month support turned resistance (R1) at 0.335 during the week (18 Feb 19). The stock churned out 1.381bil volume and it still failed to close above R1.
If you're keen to establish a position in this counter (irregardless whether you're trader or investor), the best timing is probably after it stays firmly above the resistance R1. The shooting star weekly candle indicates the selling pressure when the stock traded near 0.335. Hence, ruling out a downside reversal at this juncture would be premature.
$SAEN.KL #FBMKLCI #KLCI #BursaMalaysia

Who have the best setup? Techbond & Sapura EnergyStrength / Weakness in the chart:
1. TechBond
a. False breakout
b. Back to accumulation stage
2. Sapura Energy
a. No follow thru yet after high volume upbars
b. Testing the resistance
Send us your preference stock to review based on TradeVSA chart by comment at below.
Disclaimer
This information only serves as reference information and does not constitute a buy or sell call. Conduct your own research and assessment before deciding to buy or sell any stock

SAPURA ENERGY; 500% Incoming !!?Saya melihat ada peluang besar di SAPURA energy dimana dijangka akan berlaku kenaikan dari paras 0.20 ke paras 1.00

SAPNRG(5218)selamat malam , SAPNRG (5218) pada 7 /2 /2019 jika kita perhatikan Bullish Pin candle telah berlaku dan hari seterusnya telah mengesahkan uptrend yang sementara kerana masih dibawah SMA150. saya jangkakan, INSYAALLAH TP1:0,290 , TP2:0.300 & TP3:0.315 . CL :0.265 ( kena ada displin kita trade pad a hari isnin ini) tolong jaga capital kita. dan ingat TRADE AT YOUR OWN RISK

SAPNRG SHORTselamat malam , SAPNRG (5218) pada 7 /2 /2019 jika kita perhatikan Bullish Pin candle telah berlaku dan hari seterusnya telah mengesahkan uptrend yang sementara kerana dibawah SMA150. saya jangkakan, INSYAALLAH TP1:0,290 , TP2:0.300 & TP3:0.315 . CL :0.265 ( kena ada displin kita trade pad a hari isnin ini) tolong jaga capital kita. dan ingat TRADE AT YOUR OWN RISK

Sapura Energy bearish and bullish breakout pointShould Sapura Energy break final support, it will be bearish. Breakout at R1 is bullish for short term. R2 will determine long term bullish.

Analisi TradeVSA bagi Saham Sapura Energy BerhadPenarafan Bearish bagi Saham (Ratings) : 83.3 %
Analisi TradeVSA bagi Saham Sapura Energy Berhad SAPNRG
tradingview.com
1. Pada 2018-09-25, SAPNRG telah berniaga RM 0.44 dan perubahan % dari bar terakhirnya, iaitu 2.32 %, (+0.01, RM 0.43). Dan harga 3-Bulan rendah juga. Keadaan pasaran dikira sebagai sangat bearish bagi kaunter saham SAPNRG. Kelemahan SAPNRG adalah dalam latar 30 bar terakhir sebelumnya. Terdapat 4 (SOW - Sign of Weakness) tanda kelemahan.
2. Sila BERWASPADA apabila ternampak tanda-tanda kekuatan utama seperti Line Change (L C)/ Perubahan Barisan dan CNS (Confirmed No Supply)/Konfirmasi Tiada Bekalan & tanda kelemahan utama seperti Upthrust/ Tujah Atas (UT) dan SO (Selloff/ Menjual).
3. SAPNRG berada dalam Kawasan panas Merah /(Red HeatZone). Ini bermaksud trend masih boleh menurun atau mungkin harga saham akan lebih mengundur.
Individu perlu menunggu bar pengesahan bagi SO (Sell-Off/Menjual) bagi meneruskan trend ke bawah atau Line
Change/Perubahan Garisan (L C) bagi pengunduran trend (trend reversal).
Penafian: Kandungan maklumat bagi saham yang tersebut adalah under rujukan persendirian dan untuk pendidikan saham sewajar. Maklumat tersebut tidak bermaksud untuk panggilan menjual atau membeli. Sila merujuk kepada penyelidikan yang waras dan teliti sebelum ingin membeli atau menjual apa-apa saham tersebut.


Trade opportunity in Intraday - Sapura Energy (5128.KL)
Trading in shorter timeframe create more opportunites and allow precise entry point on than longer timeframe. Below are the opportunity to trade Sapura Energy using hourly chart.
Reason for entry:
1. Bullish Green HeatZone
2. Long accumulation in the background based on hourly chart
3. 18 Line Change with high volume
Exit strategy:
1. ATR Stop Loss - RM0.43
2. Bearish HeatZone

Hidden Potential Selling by Smart Money - Sapura Energy (5218.KL
How to spot selling from Smart Money?
1. Widespread up-bar with high volume and immediately saw 2 weaknesses (UT) in June 2018
2. Another widespread up-bar with high volume but no follow through on next days in July 2018
3. Red bearish Heatzone indicate current market at stage 4 (distribution)

SAPNRG (new analysis) using GannThis is a new TA of SAPNRG (Bursa Malaysia) after its surprised announcement today on second-half of trading session.
the small red square is where the price expected to cross at the date shown at the bottom of the chart.
but, more importantly is that for today price to close in Gann Fan 1/8 that is above 0.475. otherwise it is like game-over for a while.

Sapura Energy Reversal?The announcement about right issue has created panic selling by the existing investors who are not willing to come out with extra capital and the price plunge down to 0415 as at Friday. Today the price keep coming down however, there is like a buying momentum coming in at 038 to 039. Is this the point of reversal?

sapura energy (sapnrg) (bursa malaysia)- quite difficult to draw box coz it is hard to determine the cycle.
- the overlapping Gann box because of assumption of few starting cycles.
- Price has followed redbox tell the border, which we can expect price will react, around 20/8, and follow new greenbox, hence starting of uptrend of this stock.
- if cycle follows the overlapping greenbox, then price is expected to react around 4/9.

SAPURA ENERGY ACQUIRED BY EPF AT THE LOWEST PRICE RM0.585SEN.SAPURA ENERGY was acquired by EPF at the lowest price RM0.585Sen. This stock is good for investment with dividend yield 1.71% . For long term this stock may achieve the final target profit level fibonacci 4.236% at RM1.50.
