SCICOME: FISHY? Guess what?
Disclaimer:
For discussion and sharing purpose only. NOT entry recommendation. Trade at your own risk.
#TAYOR
Next report date
—
Report period
—
EPS estimate
—
Revenue estimate
—
0.055 MYR
24.35 M MYR
224.00 M MYR
118.97 M
About SCICOM (MSC) BHD
Sector
CEO
Suresh Ariyanayakam
Website
Headquarters
Kuala Lumpur
Founded
1997
ISIN
MYQ0099OO000
FIGI
BBG000C3FMY7
Scicom (MSC) Bhd. is an investment holding company, which engages in the provision of customer contact center services. It operates through the Outsourcing Services and Education segments. The Outsourcing Services segment is involved in the BPO services which offer multi-lingual, multi-channel customer care, technical support help desks, consultative sales, and associated fulfilment. The Education segment includes educational and industrial training services primarily focused on customer care in the service industry. The company was founded in 1997 and is headquartered in Kuala Lumpur, Malaysia.
Related stocks

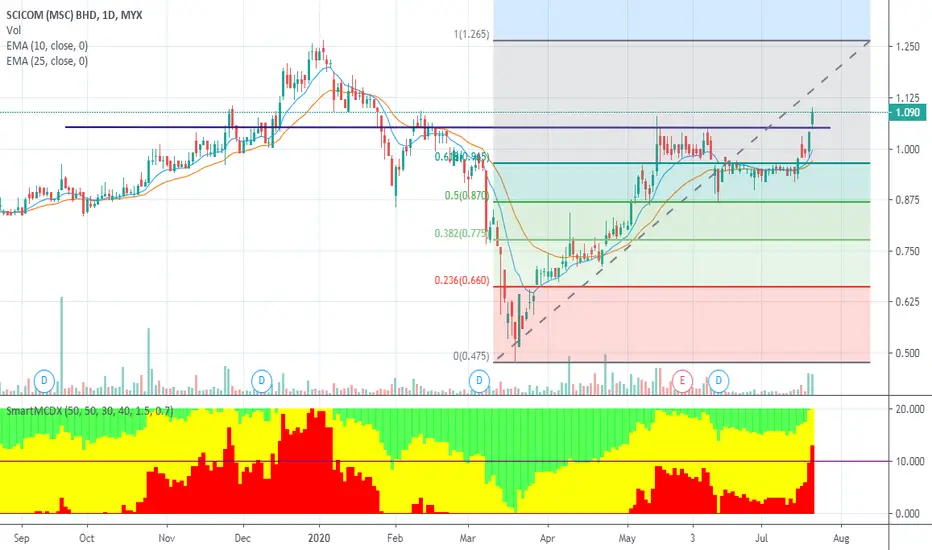
SCICOM: DIVIDEND + CAPITAL GAIN OPPORTUNITY?- Assuming Uptrend WAVE 2 on-going
- Assume that 2(i), currently having triangle consolidation on 2(ii)
- Volume profile showing accumulation around the triangle too
- Target estimation based on 0.618 of Main WAVE 1 and 2.618 of current 2(i) wave
Disclaimer:
For discussion and sharing purpose only


<TradeVSA> Shakeout Completed in SCICOM Sign of Strength in the chart:
1. Shakeout in Daily Chart
2. NS Signal with Green Pentagon in Weekly Chart
Disclaimer
This information only serves as reference information and does not constitute a buy or sell call. Conduct your own research and assessment before deciding to buy or sell any stock


SCICOM CUP&HANDLE: PENDING SLOW TURTLE BUY ON BREAKOUT MYX:SCICOM
Trend: Uptrend EMA 20 Cross Up EMA 50
Chart Pattern: Cup and Handle
FiFT +VE
MCDX+ Banker 70%
Atom above the river potential rally
Fundamental Analysis
Scicom BPO provides digital enhanced support solutions that businesses need to meet and exceed expectation. The Co Business Process Out

Scicom, another counter in greenMSC...can someone tell me any news coming? My chart already smell it.

SCICOM 31/7/2020Broke out from a head and shoulder pattern earlier and retraced back on major support line. Uptrend still intact.
EP: 1.00-1.01
TP: 1.15, 1.280, 1.36
CL: 0.965

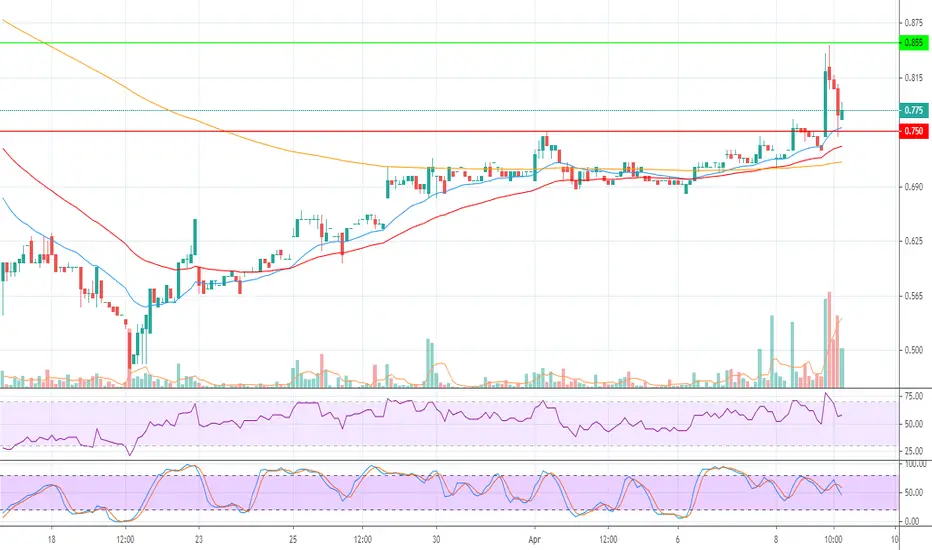
SCICOM: Trading BuyBuy on dip opportunity. Cutloss if fall below 0.75. Lets target the recent high of 0.85.
See all ideas
Summarizing what the indicators are suggesting.
Oscillators
Neutral
SellBuy
Strong sellStrong buy
Strong sellSellNeutralBuyStrong buy
Oscillators
Neutral
SellBuy
Strong sellStrong buy
Strong sellSellNeutralBuyStrong buy
Summary
Neutral
SellBuy
Strong sellStrong buy
Strong sellSellNeutralBuyStrong buy
Summary
Neutral
SellBuy
Strong sellStrong buy
Strong sellSellNeutralBuyStrong buy
Summary
Neutral
SellBuy
Strong sellStrong buy
Strong sellSellNeutralBuyStrong buy
Moving Averages
Neutral
SellBuy
Strong sellStrong buy
Strong sellSellNeutralBuyStrong buy
Moving Averages
Neutral
SellBuy
Strong sellStrong buy
Strong sellSellNeutralBuyStrong buy
Displays a symbol's price movements over previous years to identify recurring trends.
Frequently Asked Questions
The current price of SCICOM is 0.945 MYR — it has decreased by −2.62% in the past 24 hours. Watch SCICOM (MSC) BHD stock price performance more closely on the chart.
Depending on the exchange, the stock ticker may vary. For instance, on MYX exchange SCICOM (MSC) BHD stocks are traded under the ticker SCICOM.
SCICOM stock has risen by 1.64% compared to the previous week, the month change is a 2.76% rise, over the last year SCICOM (MSC) BHD has showed a 0.53% increase.
SCICOM reached its all-time high on Mar 18, 2016 with the price of 2.450 MYR, and its all-time low was 0.210 MYR and was reached on Apr 10, 2009. View more price dynamics on SCICOM chart.
See other stocks reaching their highest and lowest prices.
See other stocks reaching their highest and lowest prices.
SCICOM stock is 2.69% volatile and has beta coefficient of 0.48. Track SCICOM (MSC) BHD stock price on the chart and check out the list of the most volatile stocks — is SCICOM (MSC) BHD there?
Yes, you can track SCICOM (MSC) BHD financials in yearly and quarterly reports right on TradingView.
SCICOM (MSC) BHD is going to release the next earnings report on Aug 29, 2025. Keep track of upcoming events with our Earnings Calendar.
SCICOM net income for the last quarter is 3.77 M MYR, while the quarter before that showed 4.56 M MYR of net income which accounts for −17.38% change. Track more SCICOM (MSC) BHD financial stats to get the full picture.
SCICOM (MSC) BHD dividend yield was 7.18% in 2024, and payout ratio reached 94.89%. The year before the numbers were 6.90% and 87.91% correspondingly. See high-dividend stocks and find more opportunities for your portfolio.
As of Aug 2, 2025, the company has 4.39 K employees. See our rating of the largest employees — is SCICOM (MSC) BHD on this list?
EBITDA measures a company's operating performance, its growth signifies an improvement in the efficiency of a company. SCICOM (MSC) BHD EBITDA is 45.42 M MYR, and current EBITDA margin is 23.27%. See more stats in SCICOM (MSC) BHD financial statements.
Like other stocks, SCICOM shares are traded on stock exchanges, e.g. Nasdaq, Nyse, Euronext, and the easiest way to buy them is through an online stock broker. To do this, you need to open an account and follow a broker's procedures, then start trading. You can trade SCICOM (MSC) BHD stock right from TradingView charts — choose your broker and connect to your account.
Investing in stocks requires a comprehensive research: you should carefully study all the available data, e.g. company's financials, related news, and its technical analysis. So SCICOM (MSC) BHD technincal analysis shows the buy rating today, and its 1 week rating is buy. Since market conditions are prone to changes, it's worth looking a bit further into the future — according to the 1 month rating SCICOM (MSC) BHD stock shows the neutral signal. See more of SCICOM (MSC) BHD technicals for a more comprehensive analysis.
If you're still not sure, try looking for inspiration in our curated watchlists.
If you're still not sure, try looking for inspiration in our curated watchlists.