SKPRESGood fundamental company, last week just make a reversal sign with breakout downtrend.
Can go higher with current price, use to rebound on EMA 6 and Maa20
Hope this hint can help you guys secure 30% profit ✅
Next report date
—
Report period
—
EPS estimate
—
Revenue estimate
—
0.075 MYR
117.03 M MYR
2.22 B MYR
735.92 M
About SKP RESOURCES BHD
Sector
Industry
CEO
Poh San Gan
Website
Headquarters
Johor Darul
Founded
2000
ISIN
MYL7155OO004
FIGI
BBG000BNC4F8
SKP Resources Bhd. is an investment holding company, which engages in the provision of management services to the subsidiaries. Its products and services include design and engineering, tool and die fabrication, injection moulding and cosmetic finishing, contract manufacturing and component assembly, manufacturing services, and logistics and fulfillment. The company was founded on August 23, 2000 and is headquartered in Johor Darul, Malaysia.
Related stocks

SKPRES, still downtrend at this moment Price forming lower.
>> May pullback.
>> Let see whether it able to form a new HL.
>> Qr soon, how about the previous qr result? Similar case happen?
Disclaimer: Mentioned stocks are solely based on own opinions for education and/or discussion purpose only. There's no buy and/or sell recommenda

SKPRES 4HSKPRES 4H
The stock jumped and tested the RM1.77 resistance level with a white bullishcandle yesterday.A short-term uptrend is now underway given the higher highsand higher lows formation from its 52-week low of RM1.17.Traders may go long now or accumulate on a pullback, while setting a stoploss at

SKP RESOURCE BHD OUTLOOK 09/06/2022SKP RESOURCE BHD:-
This Counter having a continue Uptrend from From last 3 days and is expected to do the same ahead.
the started the uptrend right from 1.565 and is now at 1.700 and is expected to move up to 1.750 and if i t break the 1.760 mark then a price of 1.850 can be expected.
Support:- 1.5

SKPRESS Not Complete Correction Wave 4This is my prediction for SKPRESS . 100% wrong but if it goes right then its only coincidence. Possible places to monitor is @Fib 0.786- soon then it will rebound from there to make Impulsive wave 12345 to Wave Cycle 5

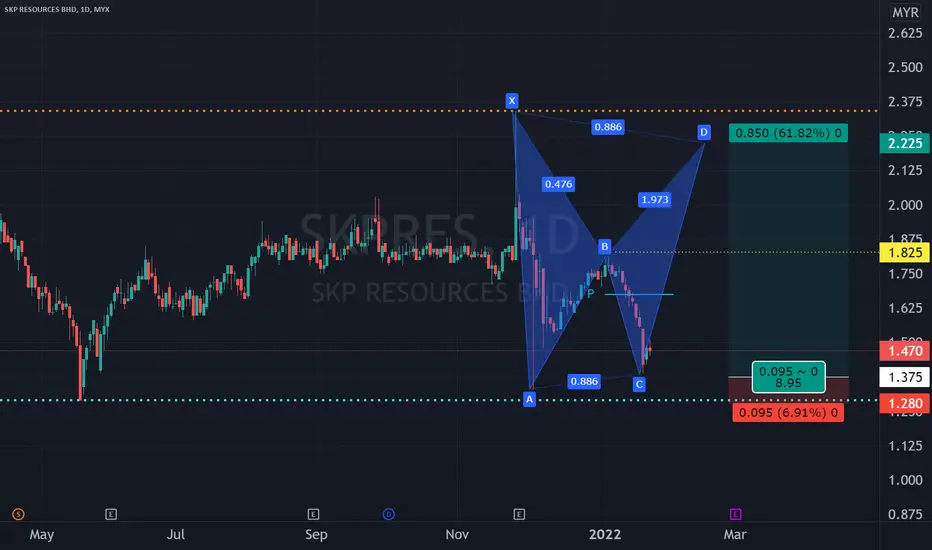
SKPRES IN HARMONIC PATTERNConsider to study and monitor SKPRES's current daily chart which resembles that of a bearish bat pattern where a potential swing trade can be taken from Point C to Point D. Probable EP is at fibo886 retest (1.370/5) and the probable TPs are at Point B (1.825) and Point D (2.225). The probable CL is
SKPRES TECHNICAL ANALYSISTechnical analysis for SKPRES Stock based on Trend Analysis, Chart Pattern and VPA
1) In Monthly TF
- Overall trend still maintaining the long term UTL. Retracement occur from Feb-May 21 candle and rebound at Fibo 0.382 are considered neutral retracement in healthy trend.
- Current price candle tren


SKPRES could see further upside in the coming weeksMYX:SKPRES has broken out and is looking to further rally to an immediate target of RM2.05 then RM2.25
What do you think?

SKPRES VCP SETUPSKPRES developing VCP with below contraction:
C1: -36%
C2: -12%
C3: -7%
C4: -7%
C5: <5%
Awaiting breakout with volume.
Disclaimer:
Not a buy call recommendation, technical analysis sharing based on chart pattern. Trade at your own risk.

See all ideas
Summarizing what the indicators are suggesting.
Neutral
SellBuy
Strong sellStrong buy
Strong sellSellNeutralBuyStrong buy
Neutral
SellBuy
Strong sellStrong buy
Strong sellSellNeutralBuyStrong buy
Neutral
SellBuy
Strong sellStrong buy
Strong sellSellNeutralBuyStrong buy
An aggregate view of professional's ratings.
Neutral
SellBuy
Strong sellStrong buy
Strong sellSellNeutralBuyStrong buy
Neutral
SellBuy
Strong sellStrong buy
Strong sellSellNeutralBuyStrong buy
Neutral
SellBuy
Strong sellStrong buy
Strong sellSellNeutralBuyStrong buy
Displays a symbol's price movements over previous years to identify recurring trends.
Frequently Asked Questions
The current price of SKPRES is 0.945 MYR — it hasn't changed in the past 24 hours. Watch SKP RESOURCES BHD stock price performance more closely on the chart.
Depending on the exchange, the stock ticker may vary. For instance, on MYX exchange SKP RESOURCES BHD stocks are traded under the ticker SKPRES.
SKPRES stock has risen by 1.07% compared to the previous week, the month change is a −7.35% fall, over the last year SKP RESOURCES BHD has showed a −18.53% decrease.
We've gathered analysts' opinions on SKP RESOURCES BHD future price: according to them, SKPRES price has a max estimate of 1.46 MYR and a min estimate of 1.20 MYR. Watch SKPRES chart and read a more detailed SKP RESOURCES BHD stock forecast: see what analysts think of SKP RESOURCES BHD and suggest that you do with its stocks.
SKPRES reached its all-time high on Nov 25, 2021 with the price of 2.340 MYR, and its all-time low was 0.010 MYR and was reached on Nov 16, 2006. View more price dynamics on SKPRES chart.
See other stocks reaching their highest and lowest prices.
See other stocks reaching their highest and lowest prices.
SKPRES stock is 3.21% volatile and has beta coefficient of 1.58. Track SKP RESOURCES BHD stock price on the chart and check out the list of the most volatile stocks — is SKP RESOURCES BHD there?
Yes, you can track SKP RESOURCES BHD financials in yearly and quarterly reports right on TradingView.
SKP RESOURCES BHD is going to release the next earnings report on Sep 1, 2025. Keep track of upcoming events with our Earnings Calendar.
SKPRES net income for the last quarter is 30.25 M MYR, while the quarter before that showed 25.61 M MYR of net income which accounts for 18.13% change. Track more SKP RESOURCES BHD financial stats to get the full picture.
Yes, SKPRES dividends are paid annually. The last dividend per share was 0.03 MYR. As of today, Dividend Yield (TTM)% is 3.09%. Tracking SKP RESOURCES BHD dividends might help you take more informed decisions.
SKP RESOURCES BHD dividend yield was 4.14% in 2024, and payout ratio reached 50.07%. The year before the numbers were 3.23% and 50.17% correspondingly. See high-dividend stocks and find more opportunities for your portfolio.
As of Aug 2, 2025, the company has 7.63 K employees. See our rating of the largest employees — is SKP RESOURCES BHD on this list?
EBITDA measures a company's operating performance, its growth signifies an improvement in the efficiency of a company. SKP RESOURCES BHD EBITDA is 201.48 M MYR, and current EBITDA margin is 8.06%. See more stats in SKP RESOURCES BHD financial statements.
Like other stocks, SKPRES shares are traded on stock exchanges, e.g. Nasdaq, Nyse, Euronext, and the easiest way to buy them is through an online stock broker. To do this, you need to open an account and follow a broker's procedures, then start trading. You can trade SKP RESOURCES BHD stock right from TradingView charts — choose your broker and connect to your account.
Investing in stocks requires a comprehensive research: you should carefully study all the available data, e.g. company's financials, related news, and its technical analysis. So SKP RESOURCES BHD technincal analysis shows the sell today, and its 1 week rating is sell. Since market conditions are prone to changes, it's worth looking a bit further into the future — according to the 1 month rating SKP RESOURCES BHD stock shows the sell signal. See more of SKP RESOURCES BHD technicals for a more comprehensive analysis.
If you're still not sure, try looking for inspiration in our curated watchlists.
If you're still not sure, try looking for inspiration in our curated watchlists.