SLVEST trade ideas

SLVEST - Bullish power?The price is currently hovering near the top of the Kumo, indicating potential support from the cloud. A strong bullish candle above the Kumo will confirm a trend continuation.
Chikou Span is slightly above the price candles, supporting a bullish bias, though confirmation is needed with a clear breakout.
NT (1.72): Immediate resistance. A breakout above this level would confirm a bullish continuation.
Wait for a strong daily close above 1.72 with increased volume to confirm bullish momentum.
Note:
1. Analysis for education purposes only.
2. Trade at your own risk.

SLVEST - Looking for potential bullish momentumY wave, target (E) within stipulated time.
The current price is almost exit down Kumo, suggesting a potential bullish breakout.
The Chikou Span is above the price 26 periods back, indicating potential bullish momentum.
If golden cross occur, which is typically consider a bullish signal.
Volume appears relatively consistent but should be monitored for any increases to confirm momentum.
Consider entering a long position as the price is breaking above the Kumo. This breakout could signal further upward momentum.
Place a stop loss slightly below the cloud boundary or recent low around 1.55 to manage risk if the breakout fails.
A reversal or close back within the Kumo would weaken the bullish setup.
Failure to break above the Fibonacci resistance levels at 1.67 and 1.69 may lead to consolidation or pullback.
Note:
1. Analysis for education purposes only.
2. Trade at your own risk.

SOLARVEST Short-Term Trading TA
Current Price Trade in bottom on the parallel uptrend area.
Price Action created a higher low show it going to rebound
Past 2 trading day was appeared volume increasing.
TP : 1.96 ( 20% )
SL : 1.51 ( 8 % )


Solarvest, Capitalsahamplus Algo TradingSystem Remisier CheDin The current point exhibits upward signals according to my algorithmic system, meeting various criteria. These include rising trading volume, an upward trend indicated by prices above EMA20 and EMA50, and the closing price surpassing VWAP. As a result, the present conditions suggest a potential upward trend.

SLVEST (20/9/23)Kinda like the chart, MACD reversal pattern and showing strong support at EMA50. Possible to trend up with TP 1.33 / 1.41 / 1.48.

SLVEST Bullish HaramiBased on the chart, the stock form a bullish harami pattern and near to MA50. There is a chance for the stock to go up. Moreover, the OBV is in uptrend which shows there is an accumulation in the stock. On top of that, there is a good sentiment for the company which is NETR.

SOLARVEST break down trend lineThe price still above 200 day moving average meaning in a long term uptrend
It also break down trendline and macd histogram pointing upward for upward momentum.
Entry 0.895
SL 0.830 (7.26)%
TP 1.02 14.53%
Risk to reward ratio 1:2
This is not a financial advice. TAYOR


SLVEST entering STAGE 2SLVEST is one of the big profit stock that i traded back then in 2020 based on VCP setup. I used to call this stock as SolarBest. :)
Chart entering stage 4 since Mar 2021 till Nov 2022 which was around 616 days.
Recently volume started to kick in and the chart seem turning back into stage 2.
I also like the renewable energy sector where recent year lot of factories are installing solar panel for sustainable green energy commitment. SLVEST also a net cash company.
Will update if there is any activity in future on this stocks. Feel free to comment if you got any question.
Disclaimer:
Information presented here is not intended to be used as the sole basis of any investment decisions nor should it be construed as advice designed to meet the investment need of any investor. Trade at your own risk.


SLVEST spotted breaking outCan consider to take a long position on SLVEST as spotted in daily chart breaking out. Trade as per proposed trade plan.

SLVEST 3.4.2022Comment on solarvest date 3.4.2022
Market stucture hh,hl hh hl
Remains construct hh sturucture.
Can put in ur watchlist.
Pls follow ur signal buy before enter.
Trade is simple for whom ready with plan.

SLVEST - Pullback / ContinuationIt has been on a downtrend since last March. We are now seeing a 2nd trend reversal since then. However, it has yet to break out from the main downtrend.
For this pullback, the Resistance breakout at 0.84 with a long candlestick & high volume will signal the continuation of this reversal.
TP1 is 0.99 & TP2 is 1.115

SLVEST IN BULL FLAG AND BAT PATTERNConsider to study, analyze and monitor SLVEST in its daily chart where the price actions appears to have formed a bull flag in bat harmonic pattern.

<TradeVSA> Solarvest Going to Resistance. Strong Weekly SignalSign of Strength in the chart:
1. Reaccumulation with high volume upbar
2. Shakeout and back to support
Disclaimer
This information only serves as reference information and does not constitute a buy or sell call. Conduct your own research and assessment before deciding to buy or sell any stock

STs and UTs in Phase BRevising my analysis on Solarvest. Downward trend line have been broken, confirming the newly formed trading range.

SLVEST TECHNICAL ANALYSISTechnical analysis for SLVEST Stock based on Trend Analysis, Chart Pattern and Fibonacci Retracement


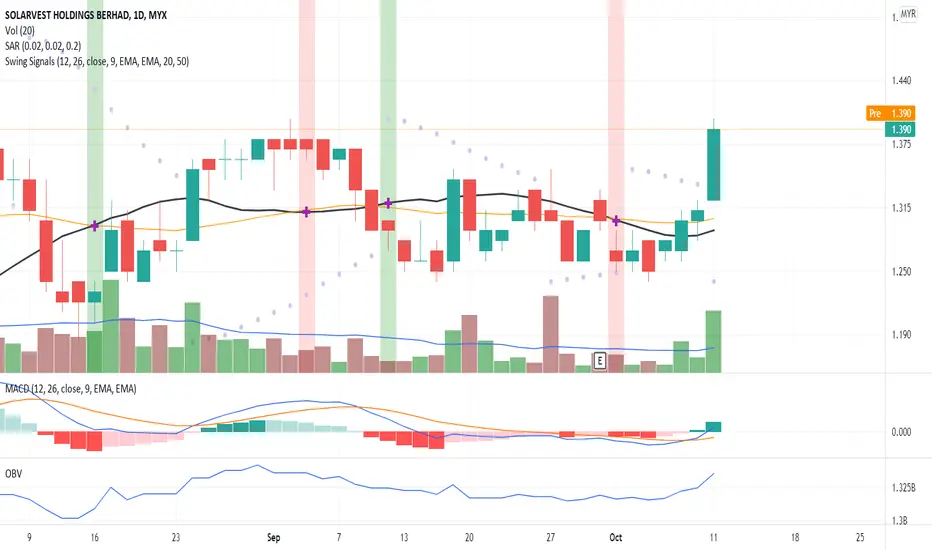
A Breakout Signal!The candlestick shows a breakout (BO) signal due to significant price movement where the volume is above MA20. MACD and OBV charts indicate a divergence signal. Hence, high possibility of an uptrend pattern. Put SLVEST in your WL and watch out for significant price movement with volume to support the uptrend.
R 1.450
S 1.310