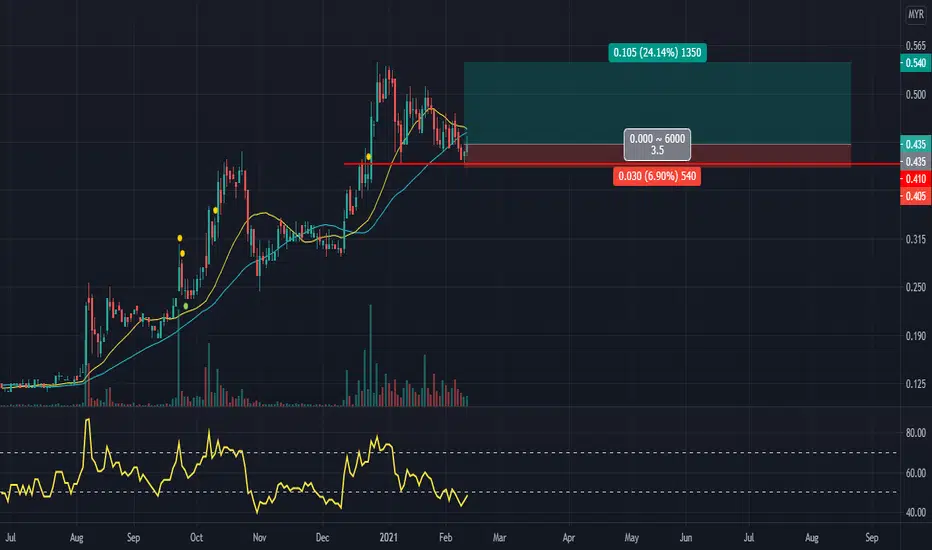
The lowest and the safest price to long SMCAP?If it follows the storyline, that's the sign to buy SMCAP. MN inverted Head and Shoulder pattern with tested every near support. If the price closes above MN strong support showed as the white line, then it is the 1st confirmation for reversal price. There is a breakout trendline of a downtrend and
−0.100 MYR
−13.15 M MYR
21.05 M MYR
About SINMAH CAPITAL BERHAD
Sector
Industry
Website
Headquarters
Kuala Lumpu
Founded
1994
ISIN
MYL9776OO005
FIGI
BBG000F4YK20
Sinmah Capital Bhd. operates as an investment holding company with interest in the contract farming, processing, marketing, and distribution of poultry products. It operates through the following business segments: Poultry, Housing Development, Healthcare services, and Other. The Poultry segment manufactures and wholesales animal feeds, poultry breeding, hatchery operations, contract farming, poultry processing and trading of feeds, day-old chicks, medications and vaccines. The Housing Development segment engages in the development and construction of residential and commercial properties. The Healthcare services segment consists of development of hospitals, running of hospitals, clinics, laboratories and related healthcare activities. The Other business segments include investment holding and provision of management services; and trading of chemicals, medication, and related equipment. The company was founded on May 26, 1994 and is headquartered in Krubong, Malaysia.
Related stocks

SMCAP IN HARMONIC PATTERNSMCAP spotted in bullish flag formation and bearish bat harmonic pattern where a probable swing trade can be taken from the current price to Point D.

dark horse july 2021 go go go sMcap using buy on Break strategicuptrend
got three white soldier if today the price 0.385
set at buy at 0.385
TP 0.423
SL 0.345

SMCAP weekly chart looks interesting.Smcap weekly chart looks interesting.
1) WXY Corrective Pattern with wave Y terminated at 0.06 on 16 March 2021.
2) Since then, smcap has been moving upwards and has breakout from the corrective channel.
3) For now, I am assuming that the upward momentum is a zigzag pattern correcting the downtre


SMCAP AnalysisDisclaimer: This is not a buy call but for learning purpose
Technical Analysis
Price around MA40
Volume OK
Potential rebound at MA line
RSI slightly below 50
SMCAP rebound from supportExpecting a rebound from bottom of the uptrend tunnel.
Selling pressure getting low, and buying momentum increase.
Risk reward ratio = 2.7
TP = 20%+
CL = -8%
Like my works? Please hit the Like, Follow and Share :)
Thanks!
Disclaimer
This information only serves as study references, does not c

SMCAP ELLIOT Following on the zigzag pattern in 4H time frame, it's look the pattern is already complete. In daily time frame it shows the impulse wave of 4 is looking good on this area 0.410. The entry is for this stock is quite good on this area, unless it break 0.410, the correction will be change from ABC to


See all ideas
Summarizing what the indicators are suggesting.
Oscillators
Neutral
SellBuy
Strong sellStrong buy
Strong sellSellNeutralBuyStrong buy
Oscillators
Neutral
SellBuy
Strong sellStrong buy
Strong sellSellNeutralBuyStrong buy
Summary
Neutral
SellBuy
Strong sellStrong buy
Strong sellSellNeutralBuyStrong buy
Summary
Neutral
SellBuy
Strong sellStrong buy
Strong sellSellNeutralBuyStrong buy
Summary
Neutral
SellBuy
Strong sellStrong buy
Strong sellSellNeutralBuyStrong buy
Moving Averages
Neutral
SellBuy
Strong sellStrong buy
Strong sellSellNeutralBuyStrong buy
Moving Averages
Neutral
SellBuy
Strong sellStrong buy
Strong sellSellNeutralBuyStrong buy
Displays a symbol's price movements over previous years to identify recurring trends.
Frequently Asked Questions
The current price of SMCAP is 0.045 MYR — it hasn't changed in the past 24 hours. Watch SINMAH CAPITAL BERHAD stock price performance more closely on the chart.
Depending on the exchange, the stock ticker may vary. For instance, on MYX exchange SINMAH CAPITAL BERHAD stocks are traded under the ticker SMCAP.
SMCAP stock hasn't changed in a week, the last month showed zero change in price, over the last year SINMAH CAPITAL BERHAD has showed a −47.06% decrease.
SMCAP reached its all-time high on Feb 20, 2006 with the price of 4.205 MYR, and its all-time low was 0.035 MYR and was reached on Apr 9, 2025. View more price dynamics on SMCAP chart.
See other stocks reaching their highest and lowest prices.
See other stocks reaching their highest and lowest prices.
SMCAP stock is 12.50% volatile and has beta coefficient of 0.78. Track SINMAH CAPITAL BERHAD stock price on the chart and check out the list of the most volatile stocks — is SINMAH CAPITAL BERHAD there?
Yes, you can track SINMAH CAPITAL BERHAD financials in yearly and quarterly reports right on TradingView.
SMCAP net income for the last quarter is −32.42 M MYR, while the quarter before that showed −1.58 M MYR of net income which accounts for −1.95 K% change. Track more SINMAH CAPITAL BERHAD financial stats to get the full picture.
No, SMCAP doesn't pay any dividends to its shareholders. But don't worry, we've prepared a list of high-dividend stocks for you.
EBITDA measures a company's operating performance, its growth signifies an improvement in the efficiency of a company. SINMAH CAPITAL BERHAD EBITDA is −47.14 M MYR, and current EBITDA margin is −76.60%. See more stats in SINMAH CAPITAL BERHAD financial statements.
Like other stocks, SMCAP shares are traded on stock exchanges, e.g. Nasdaq, Nyse, Euronext, and the easiest way to buy them is through an online stock broker. To do this, you need to open an account and follow a broker's procedures, then start trading. You can trade SINMAH CAPITAL BERHAD stock right from TradingView charts — choose your broker and connect to your account.
Investing in stocks requires a comprehensive research: you should carefully study all the available data, e.g. company's financials, related news, and its technical analysis. So SINMAH CAPITAL BERHAD technincal analysis shows the neutral today, and its 1 week rating is sell. Since market conditions are prone to changes, it's worth looking a bit further into the future — according to the 1 month rating SINMAH CAPITAL BERHAD stock shows the sell signal. See more of SINMAH CAPITAL BERHAD technicals for a more comprehensive analysis.
If you're still not sure, try looking for inspiration in our curated watchlists.
If you're still not sure, try looking for inspiration in our curated watchlists.