SMRT trade ideas

SMRT!!! ]
TAYOR
.
.
.
This message is for education and information purposes only. It shall not be construed as an offer/solicitation or recommendation to buy/sell any stocks.

SMRT GOING TO MARK UPThis is a pov from Pure Wyckoffian perspective
Few points why i am interested with this stock to trade :
1/ The line yellow marks the transition of from non trending to Trending environment
in which wyckoffian term as Change Of Character (ChoCh)
2/ The zone of contraction , in which David Weiss talks in - depth about it (Introduce by Toby Crabel)
-As pointed by Red Arrow
-This is the point where i iniated my Entry
3/ Yellow Line which indicates the Creek (Introduced and popularized by Bob Evans)
-breaking out of Creek, a typical of JAC (Jump Across The Creek)
in view of that, i attached my position
** Entry @ 2 points :
1/ rm 1.02
2/ rm1.08
Risk always be respected
Pure Wyckoff, Anything can happen

SMRT MARK UPI reiniated the position, based on previous analysis
Entry : 0.925
Stop Loss : 0.890
Take Profit (3r) : 1.030
BUEC Position
POE #3

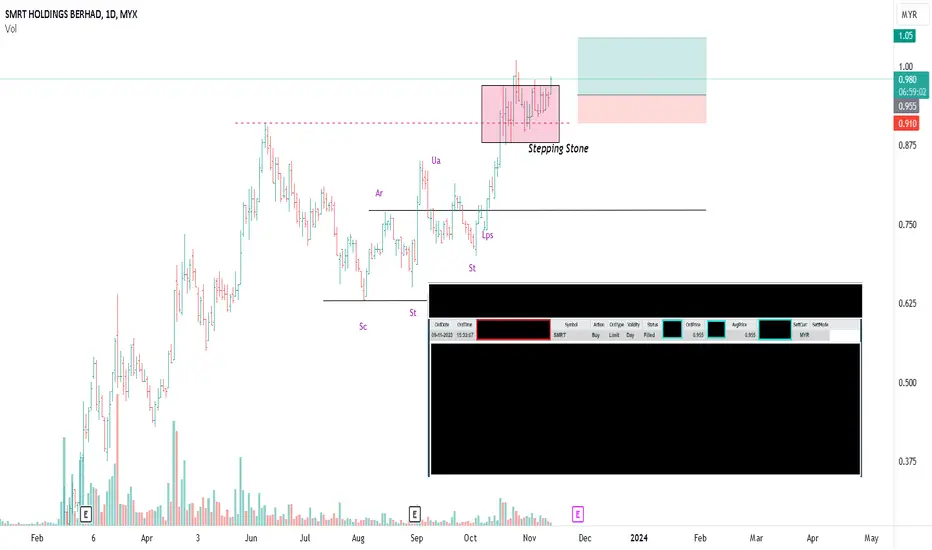
SMRT MARK UP
With the assumption of an impending Stepping Stone (Red Color Box)
which signify of a re-accumulation , i initiated a position :
Entry : 0.955
Stop Loss : 0.91
Take Profit (2r) : 1.05
I bought the share on 9 Novmeber 2023 (As Shown)
Very Short Term Trade
Pure Wyckoff Methode
SMRT, is it smart enough?
After the price broke our short-term downward trendline, it making a new Higher High and Higher Low. This is the third opportunity to entry for this stock at nearest demand zone with stop lost below our zone. Expecting the price to make a new higher high around resistance 3 level.
This message is for education and information purposes only. It shall not be construed as an offer/solicitation or recommendation to buy/sell any stocks.

SMRT TF 1WSMRT Time Frame Weekly
Finding nice pattern = Flag pattern
Already break downtrend channel
Wait going to higher and wait to break another RESISTANCE
When break the resistance going to fly and price to ATH
#thisonlyforpredectionstudy
#thisnotforbuycallorbuysell
#chartpattern
#TAYOR
#MFM.TRADER

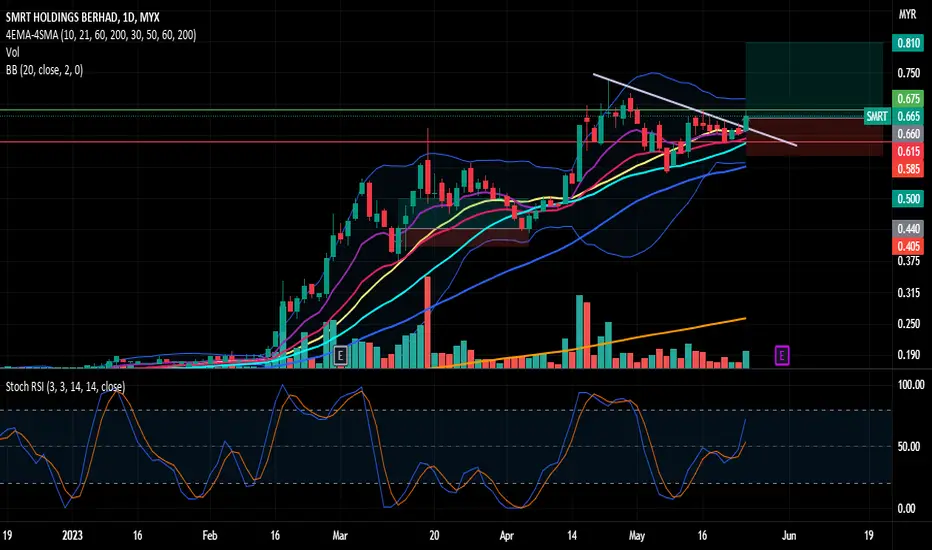
SMRT: Buy or Wait for Confirmation? Based on the chart, the price break MA20 with large volume. We can see that, the price still maintain above 0.57 and MA30 which can consider a technical chart. Now waiting the price to break the resistance 0.675. Moreover, the weekly chart shows that SMRT still in oversold region and likely to cross from that region and move higher.
Time to breakout from accumulation?There is possibility forming an arch and slowly change the behaviour
Break above 0.135 will gather more attention for trader as it breakout out of 52 week high price action


SMRT - ideas update!Note
- From the trendband chart, it shows that the price action is in bullishness mode. I jotted down some ideas on pattern appear on these trend.
- the peak_R-01 lines show a constant rally of price movement from 0.14 to 0.155 which is giving us a good sign of the trend should go on bullishness.
- the bottom_S-01 shows strongly when correction are made, the price movement shall retrace until reaching the strong support line.
What's next?
- pattern has shown some repeating reversal trend from past rally. and it might possibly repeating to happen the same result (zigzag).
- advisable to look for best entry/exit. In these case, your TP and SL should set as minimum as 3% TP: -1.5% SL

SMRT - ideas updateNote
- there some bullishness in Trendband chart. Look for pullback entry suggest


SMRT: Fly soon?With big volumes are coming in since few months ago, could it break 0.125? 0.125 is the strong resistance since Nov 18'.
By looking at the building of the volume, seems like momentum is building up to push through.
EXCITING!

MYX:SMRT 0.080All indicators already positive
Though not a solid BullishEngulfing , its enough to see more upside at least for BTST

SMRT (0117)Last price should be around RM 0.13 price level, but most likely RM 0.15 will be well supported. I have an extremely crazy idea for this stock. First strong resistance located around RM 0.230, if break thru with healthy volume inflow, i am expecting more upside potential. RM 0.300, RM 0.370, RM 0.500.
Today closing price at RM 0.15.
Disclaimer: This is not a recommendation to buy or sell. Analysis or results above are solely based on personal opinions and for personal references. Please trade at your own risk.
