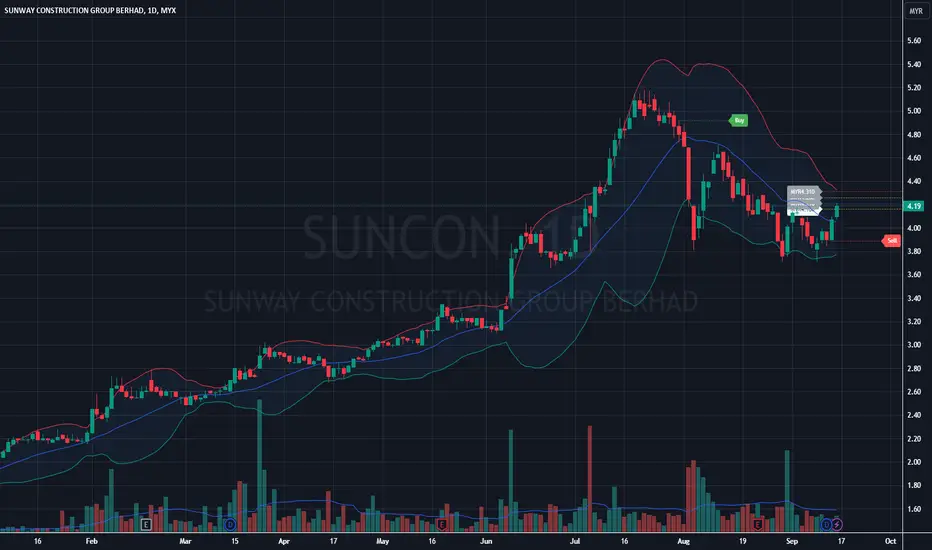
SUNWAY CONSTRUCTION GROUP BERHAD
Recently, the stock appears to be rebounding from the lower levels (around MYR4.00), currently trading at MYR4.19.
The current rebound shows the price nearing the middle band (which typically represents the 20-period moving average).
Support is observed around the MYR4.00 level, where the price has rebounded recently.
Resistance is likely to be around MYR4.40 to MYR4.50, the region of the middle Bollinger Band and the moving average.
Strong resistance is also seen at MYR5.20, the high from late July.
The stock is currently in a recovery phase after a significant correction. A break above the 50-day moving average and the middle Bollinger Band could signal further upside potential. However, the low volume during this rebound suggests caution. Traders may want to wait for a confirmation of increased volume and a solid break above key resistance levels for a stronger bullish signal.
SUNCON trade ideas
SUNCON- this stock is currently having a good project for data centre construction
- fundamentally strong and expected to gain profit till end of this year
- good for swing with repetitive entry
- target as projected

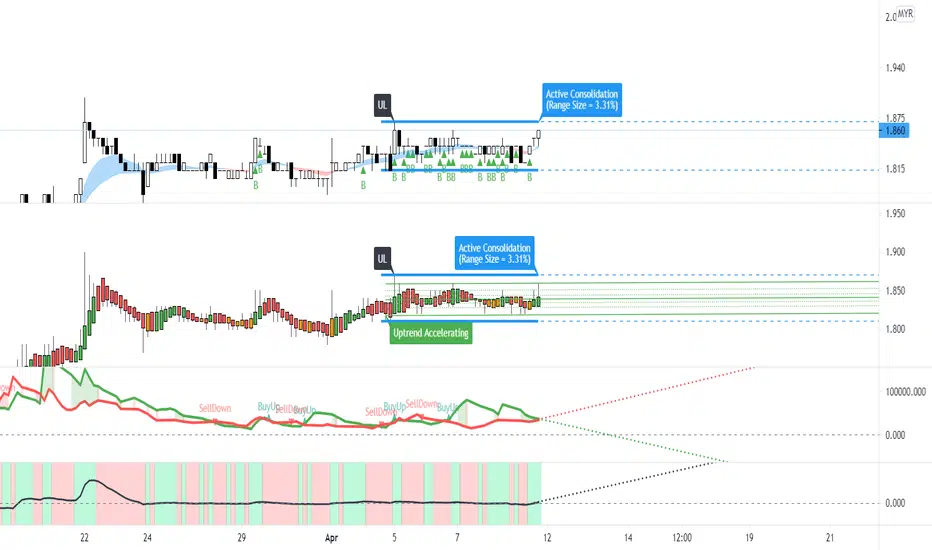
SUNCON - Pre Consolidation BreakoutNO INVESTMENT ADVICE IS PROVIDED
DISCLAIMER
Please consider your own interpretation of Opportunity & Risk. The author of this post strictly follows the Malaysian Security Commission ( SC ) Guidelines on the prohibition of Investment Advice by unlicensed parties. Any examples shall use historical charts without any recommendations and not to cause inducement to the public to take action or position (e.g. buy, sell or hold) regarding a particular class, sector, or instrument in relation to securities or derivatives. The author will never provide any investment or trading advice as the activity of giving investment advice is likely to be considered as a regulated activity under the Capital Markets and Services Act 2007 ( CMSA ). All posts made in Tradingview do not include any communications involving providing recommendations or opinions or includes any material, content or any statement which are likely to induce a person to take any action or position (e.g. buy, sell or hold) regarding a particular class, sector, or instrument in relation to securities or derivatives that is likely to be considered as “advising others concerning securities or derivatives”. The author will not recklessly make any statement, promise or forecast that is misleading, false or deceptive to induce or attempt to induce another person to deal in securities or derivatives. None of information posted in post can be used as investment decisions. Do not trade solely on the information posted. Trade at your own risk and judgement. A trader could potentially lose all money. Only risk capital that can be lost without jeopardizing ones financial security of lifestyle. Please seek licensed professional guidance if you plan to invest your capital seriously.
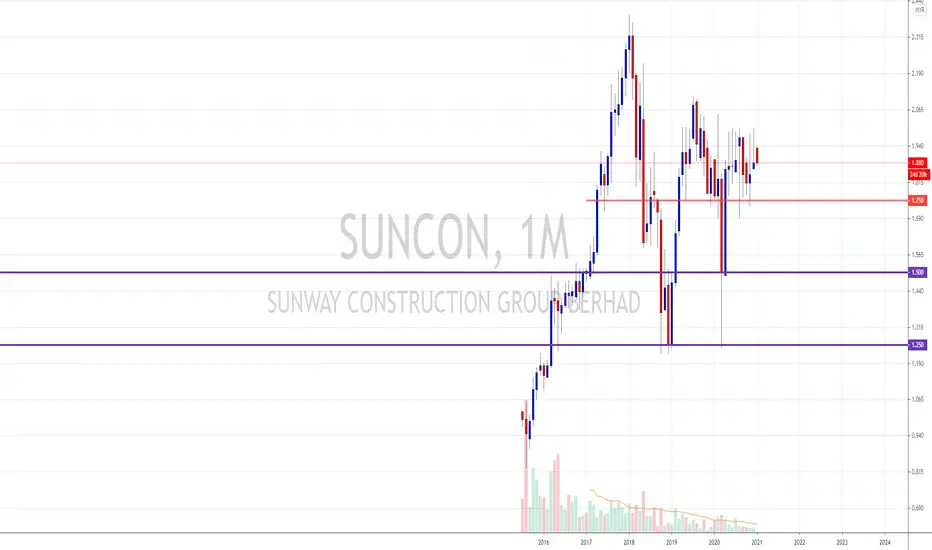
SUNCON Major Support and Resistance ChartTechnical Analysis
Personally, what I learnt is there must be a Technical Analysis Strategic Plan in order to increase the risk-to-ratios favourable risks.
1. Draw Support & Resistance
2. Identify the stages (Accumulation, Advancing, Distribution, Declining)
3. Entry Triggers
4. Stop Loss
5. Exits
I have learnt during my past mistakes that we should let the stock price comes to us, rather than us chasing the stock prices!

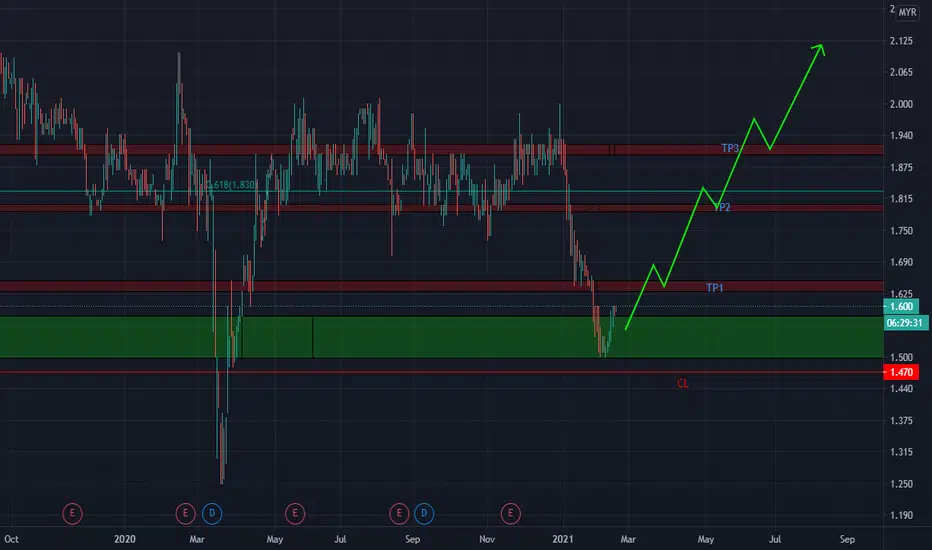
SUNCON STOCK PICK FROM EXPERT 040120212021 STOCK PICK FROM EXPERTS
PURPLE LINE = STRONGER SUPPORT
RED LINE = MINOR SUPPORT
Disclaimer:
Please be informed that above analysis are solely for education purpose; it is neither a trading advice nor an invitation to trade. For trading advice, please speak to your remisier or dealer representative.
You are responsible for your own risk management Do Your Own Due Diligence

Update on Stock Ideas - Advancecon & SunconStrength in the chart:
1. Follow thru after pullback
2. Break above resistance
Send us your preference stock to review based on TradeVSA chart by comment at below.
Disclaimer
This information only serves as reference information and does not constitute a buy or sell call. Conduct your own research and assessment before deciding to buy or sell any stock

Suncon to breakout soon?Strength in the chart:
1. Shaekout with accumulation
2. Testing supply at support
Send us your preference stock to review based on TradeVSA chart by comment at below.
Disclaimer
This information only serves as reference information and does not constitute a buy or sell call. Conduct your own research and assessment before deciding to buy or sell any stock

Suncon retracement strength to 4th waveHow strong will the retracement for suncon be? To 23.6% or 38.2% or maybe middle?
